

Question: Excel Activity: Feasible Portfolios Start with the partial model in the file Ch03 P07 Build a Model.xlsx. Following is information for the required returns
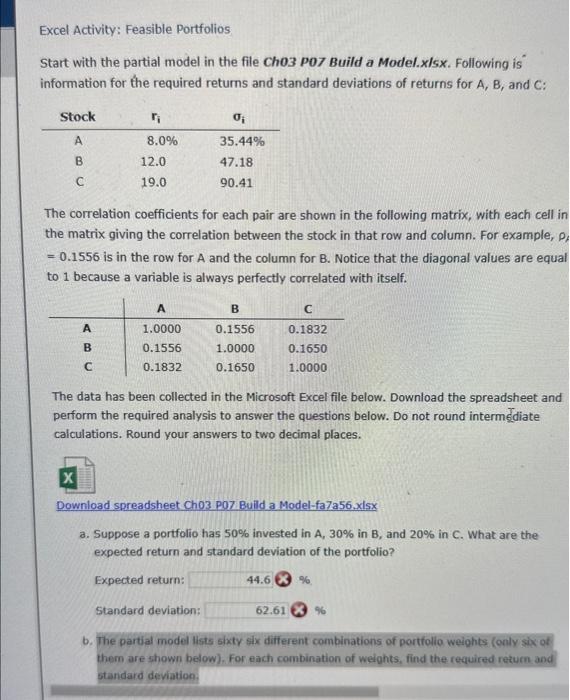
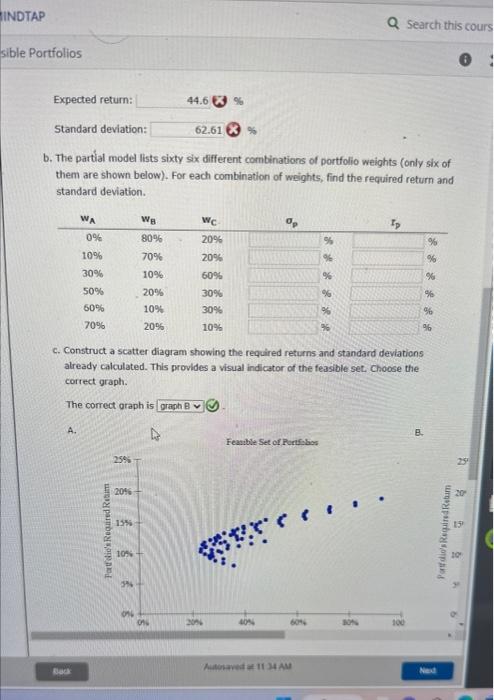
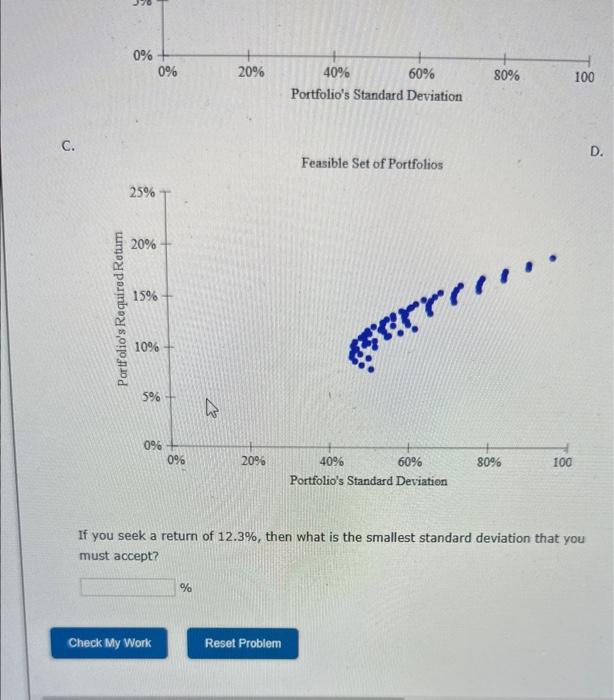
Excel Activity: Feasible Portfolios Start with the partial model in the file Ch03 P07 Build a Model.xlsx. Following is information for the required returns and standard deviations of returns for A, B, and C: Stock A 8.0% 35.44% B C 12.0 19.0 47.18 90.41 The correlation coefficients for each pair are shown in the following matrix, with each cell in the matrix giving the correlation between the stock in that row and column. For example, p = 0.1556 is in the row for A and the column for B. Notice that the diagonal values are equal to 1 because a variable is always perfectly correlated with itself. A B C A 1.0000 0.1556 0.1832 B 0.1556 1.0000 0.1650 C 0.1832 0.1650 1.0000 The data has been collected in the Microsoft Excel file below. Download the spreadsheet and perform the required analysis to answer the questions below. Do not round intermediate calculations. Round your answers to two decimal places. X Download spreadsheet Ch03 P07 Build a Model-fa7a56.xlsx a. Suppose a portfolio has 50% invested in A, 30% in B, and 20% in C. What are the expected return and standard deviation of the portfolio? Expected return: Standard deviation: 44.6 % 62.61% b. The partial model lists sixty six different combinations of portfolio weights (only six of them are shown below). For each combination of weights, find the required return and standard deviation. INDTAP sible Portfolios Expected return: 44.6 % Standard deviation: 62.61 % Q Search this cours b. The partial model lists sixty six different combinations of portfolio weights (only six of them are shown below). For each combination of weights, find the required return and standard deviation. WA WB WC 0% 80% 20% % % 10% 70% 20% % % 30% 10% 60% % % 50% 20% % % 30% 60% 10% 30% % % 70% 20% 10% %6 % c. Construct a scatter diagram showing the required returns and standard deviations already calculated. This provides a visual indicator of the feasible set. Choose the correct graph. The correct graph is graph B Black A. Portfolio's Required Retum 25% 20% 15% 10% B. Feasible Set of Portfobos 3% 096 096 20% 40% 60% Autosaved at 11 34 AM Next Por dio's Required Retu A 25 20 C. Portfolio's Required Retur 960 0% 0% 960 20% 40% 60% Portfolio's Standard Deviation 25% Feasible Set of Portfolios 20% 15% 10% 5%- 0%+ 0% 960 20% 40% serre 60% Portfolio's Standard Deviation 80% 100 80% 100 If you seek a return of 12.3%, then what is the smallest standard deviation that you must accept? % Check My Work Reset Problem D.
Step by Step Solution
There are 3 Steps involved in it

Get step-by-step solutions from verified subject matter experts