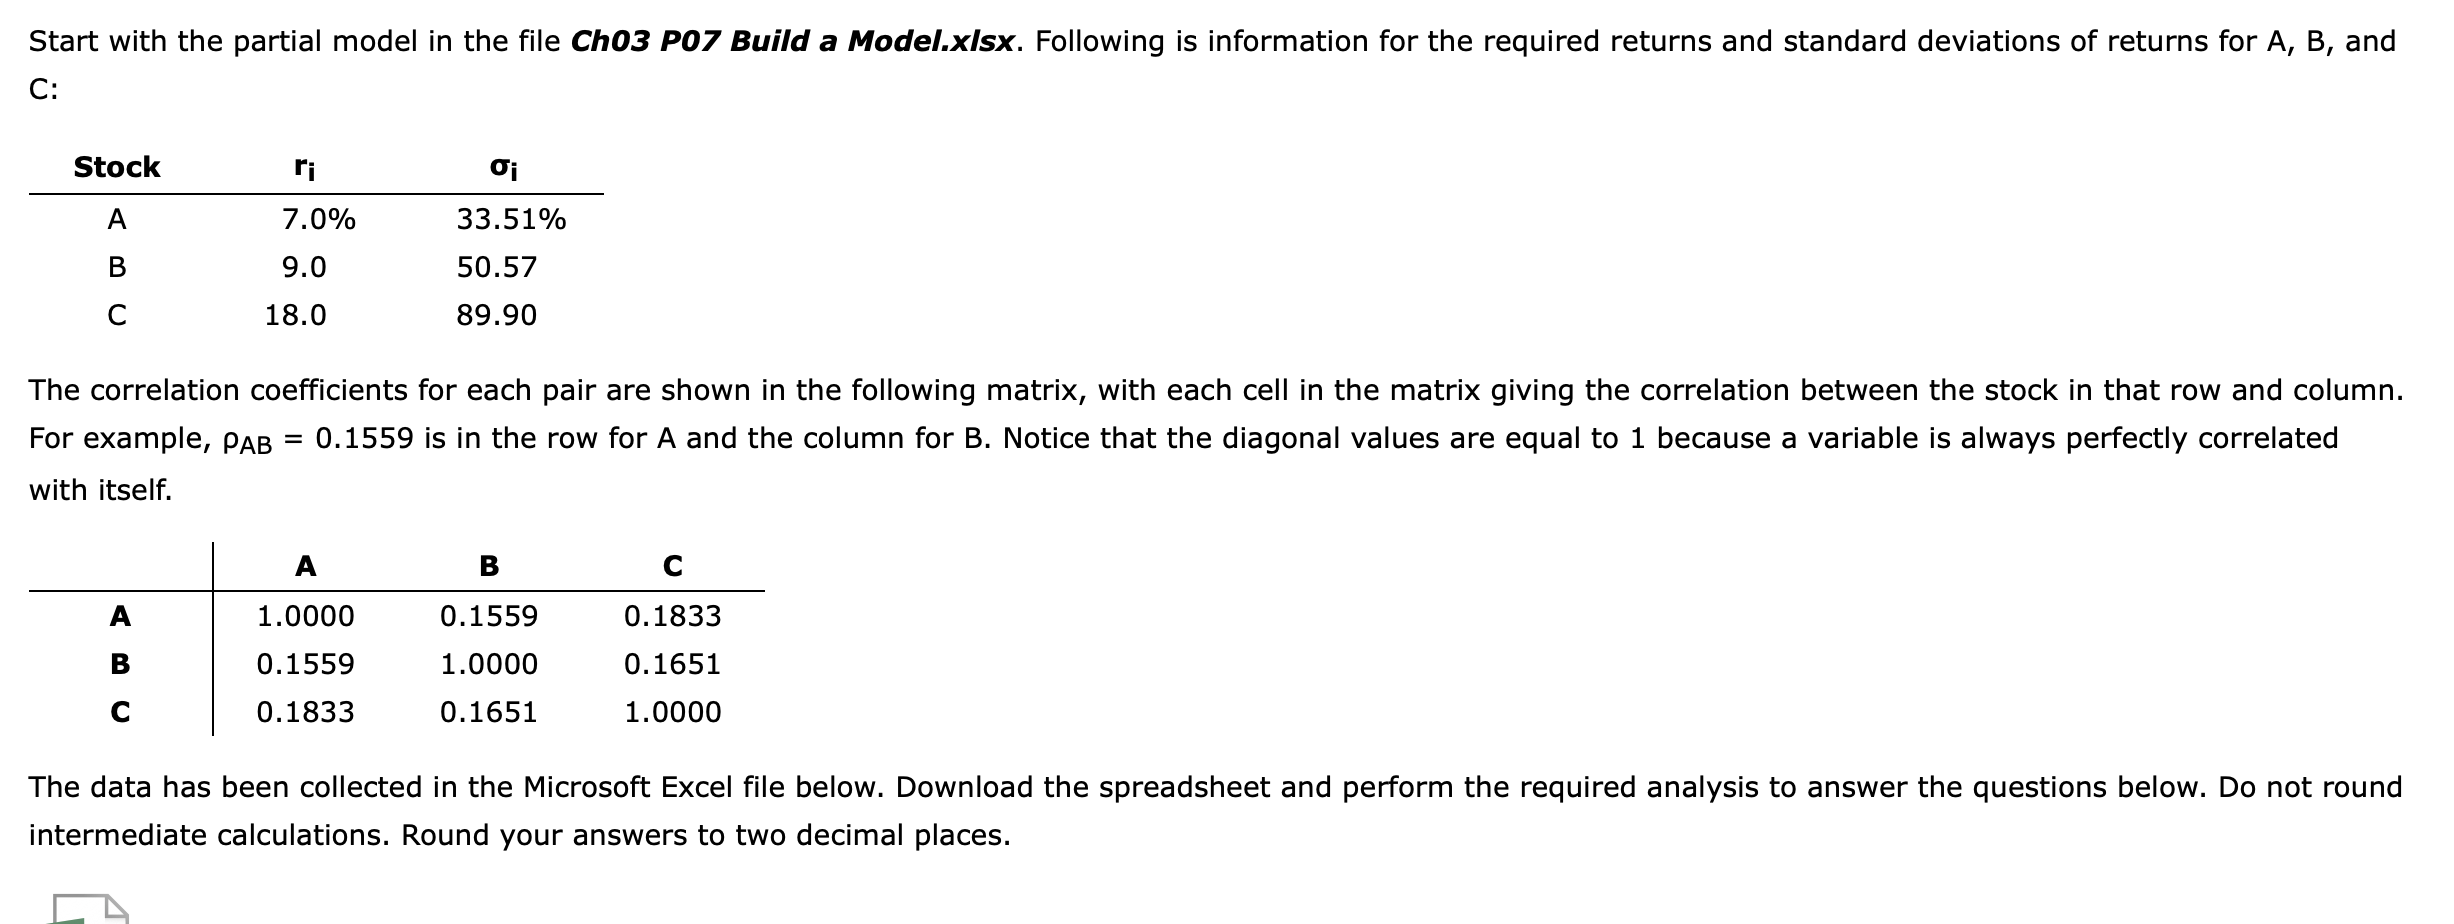
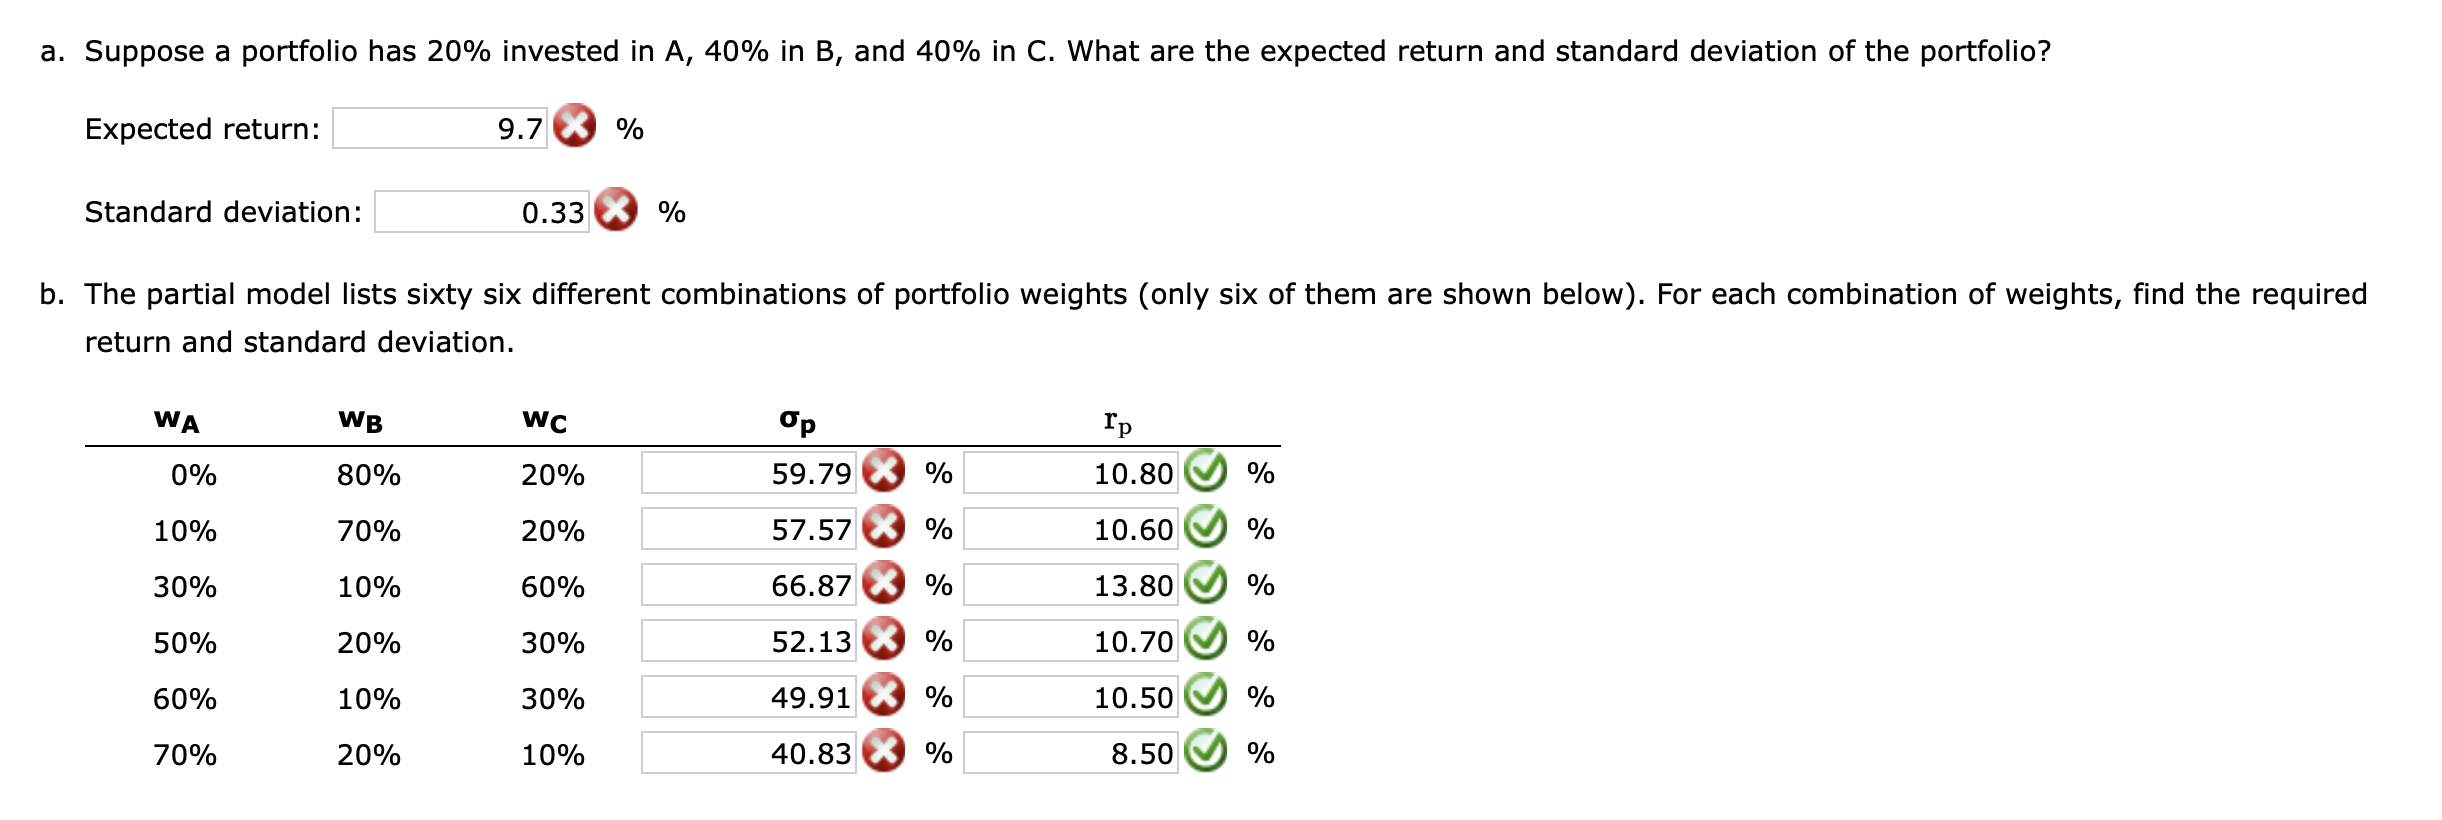
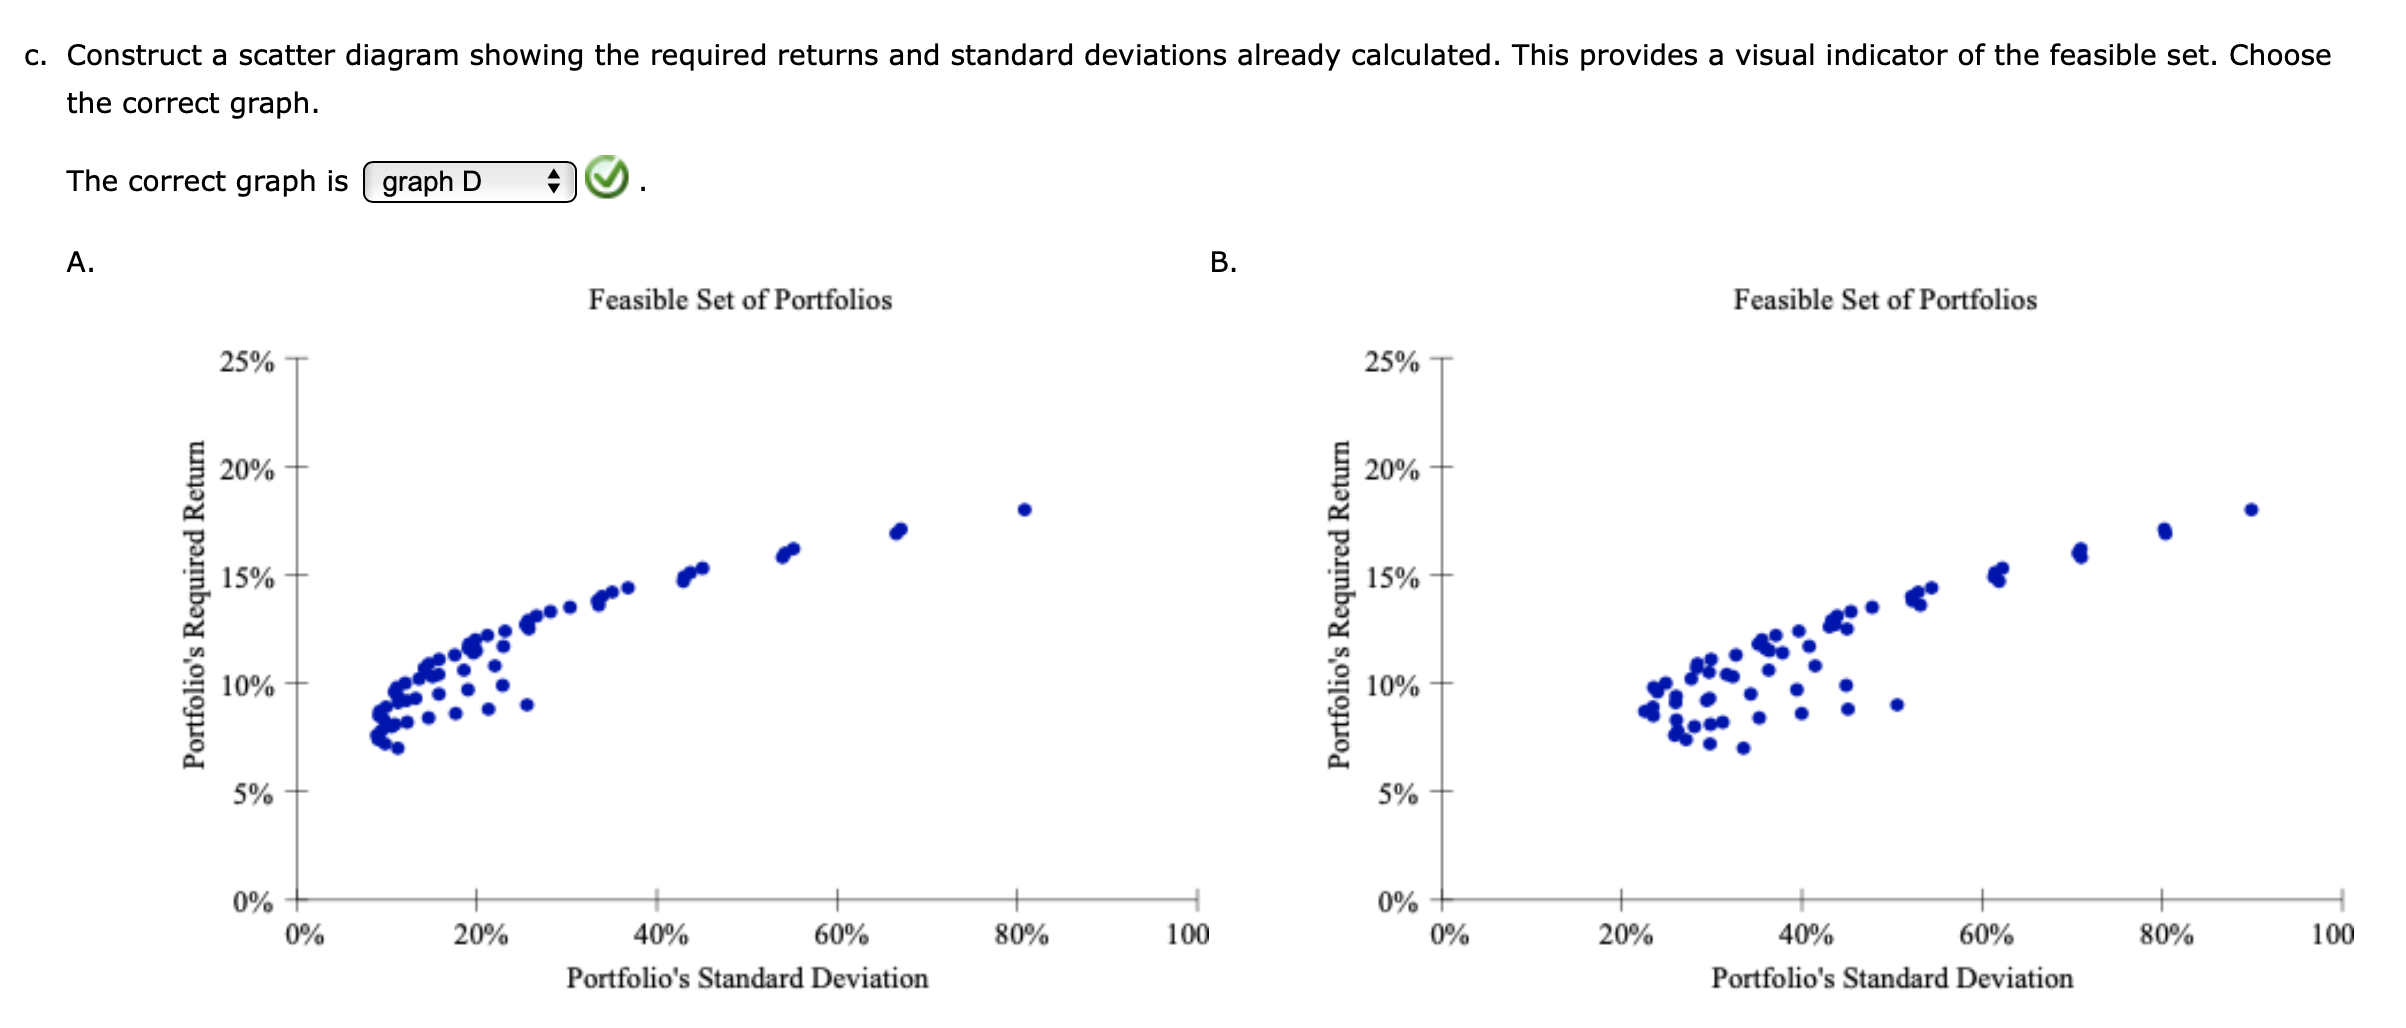
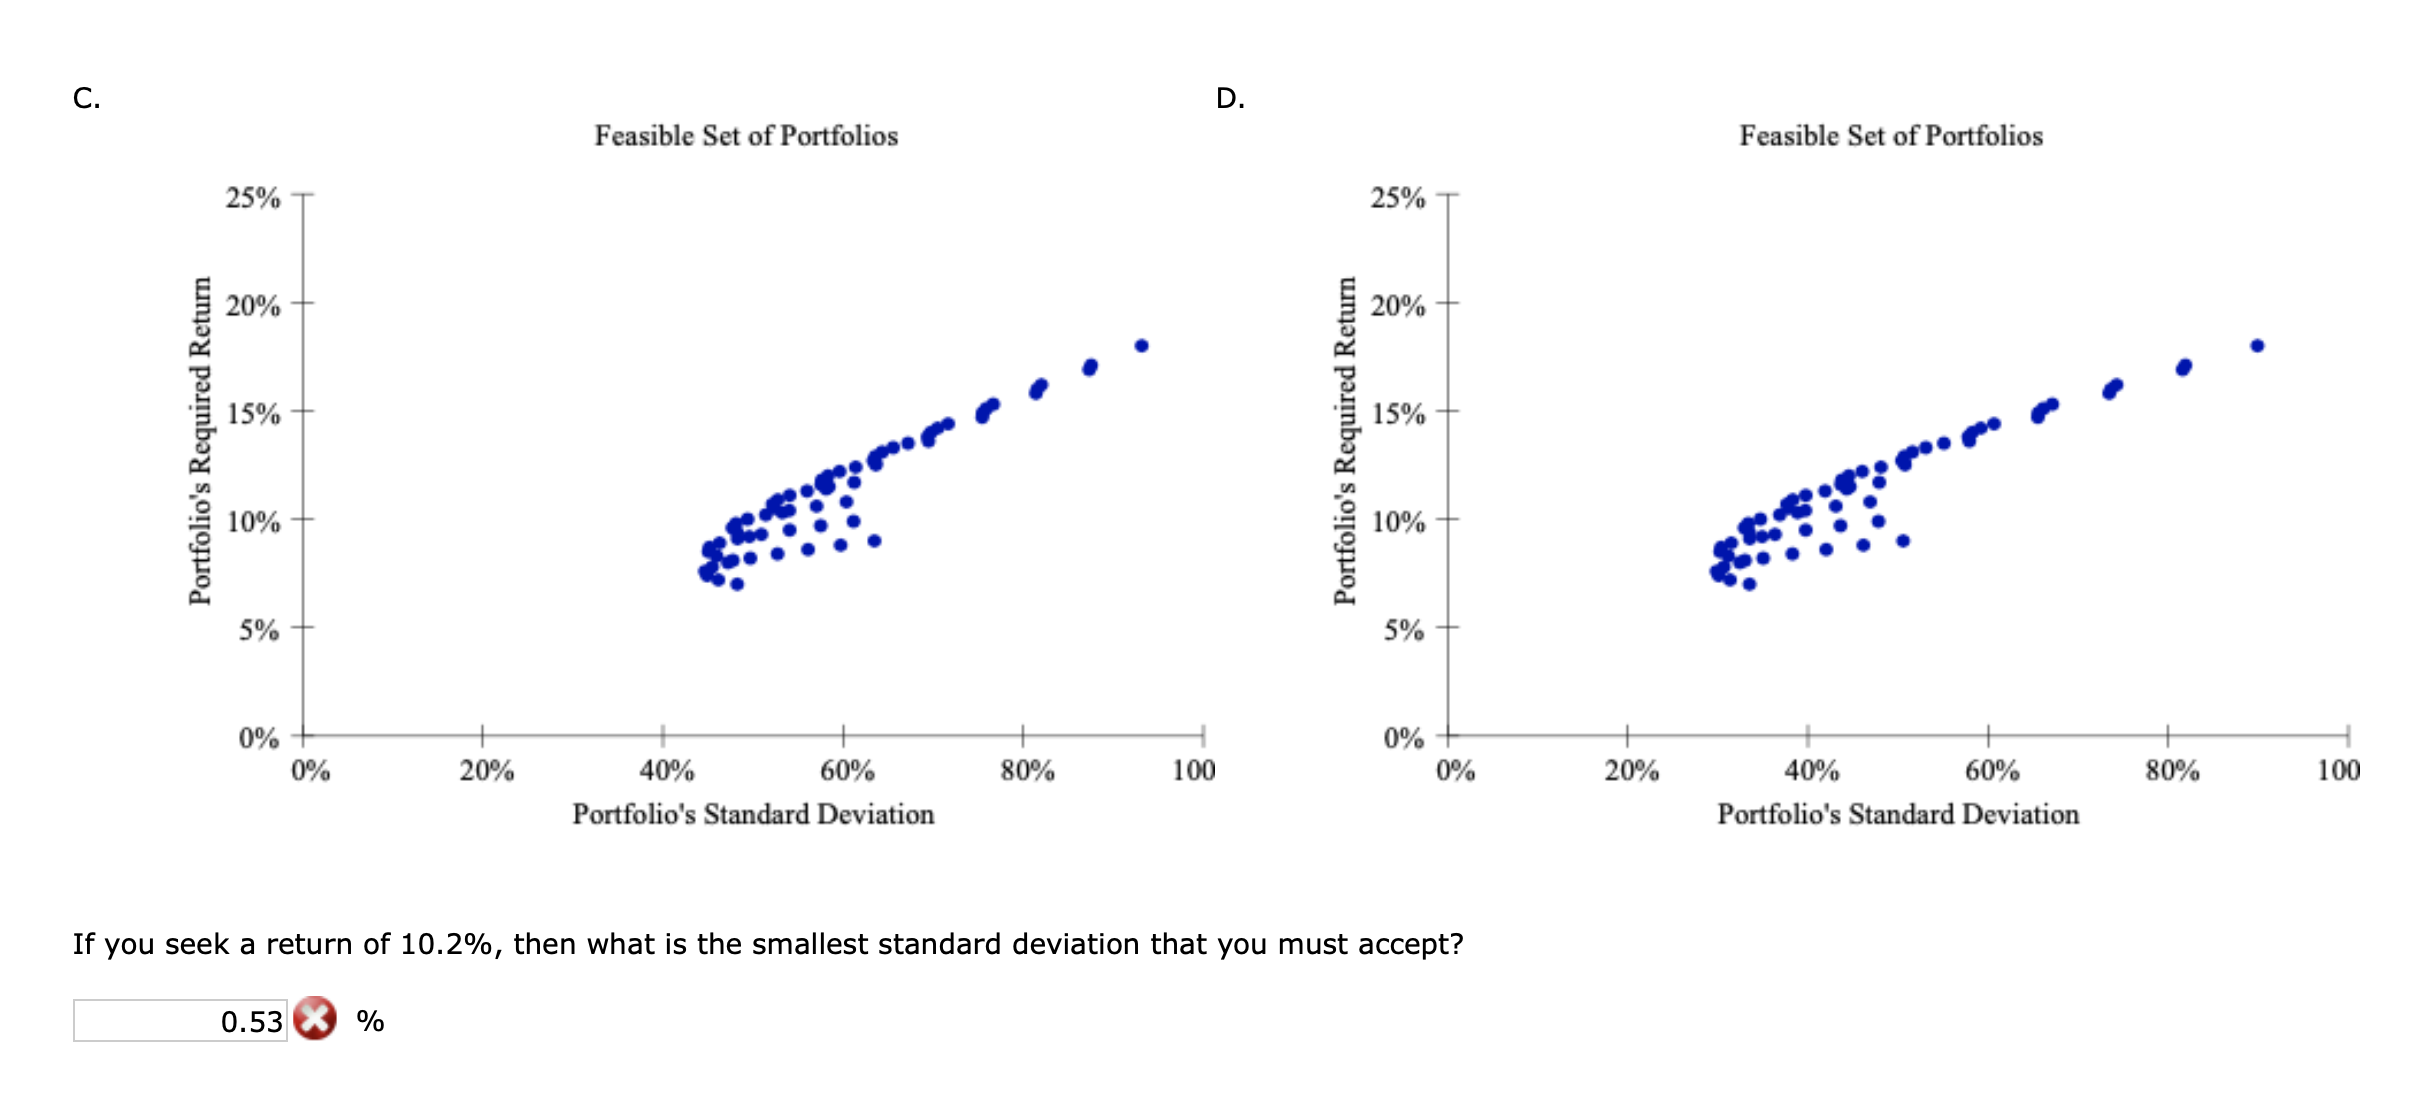
Question: Start with the partial model in the file Ch03 P07 Build a Model.xlsx. Following is information for the required returns and standard deviations of returns

Start with the partial model in the file Ch03 P07Start with the partial model in the file Ch03 P07Start with the partial model in the file Ch03 P07Start with the partial model in the file Ch03 P07
Start with the partial model in the file Ch03 P07 Build a Model.xlsx. Following is information for the required returns and standard deviations of returns for A, B, and C: Stock n 0i A 7.0% 33.51% B 9.0 50.57 C 18.0 89.90 The correlation coefficients for each pair are shown in the following matrix, with each cell in the matrix giving the correlation between the stock in that row and column. For example, pAB = 0.1559 is in the row for A and the column for B. Notice that the diagonal values are equal to 1 because a variable is always perfectly correlated with itself. A B C A 1.0000 0.1559 0.1833 B 0.1559 1.0000 0.1651 C 0.1833 0.1651 1.0000 The data has been collected in the Microsoft Excel file below. Download the spreadsheet and perform the required analysis to answer the questions below. Do not round intermediate calculations. Round your answers to two decimal places. EB. . Suppose a portfolio has 20% invested in A, 40% in B, and 40% in C. What are the expected return and standard deviation of the portfolio? Expected return: 9.7 Q % Standard deviation: 0.3310 % . The partial model lists sixty six different combinations of portfolio weights (only six of them are shown below). For each combination of weights, find the required return and standard deviation. wA w; wc an ID 0% 80% 20% l 59.79 8 %l 10.80 Q % 10% 70% 20% l 57.57 8 %l 10.60 Q % 30% 10% 60% l 66.87 8 %l 13.80 Q % 50% 20% 30% l 52.13 8 %l 10.70 Q % 60% 10% 30% l 49.91 0 %l 10.50 Q % 70% 20% 10% l 40.83 0 %l 8.50 Q % c. Construct a scatter diagram showing the required returns and standard deviations already calculated. This provides a visual indicator of the feasible set. Choose the correct graph. The correct graph is | graph D B. A. Feasible Set of Portfolios Feasible Set of Portfolios 25% 25% 20% 20% 15% po 15% po . too Portfolio's Required Return Portfolio's Required Return 10% 10% 5% 5% 0% 0% 100 0% 20% 40% 60% 80% 100 0% 20% 40% 60% 80% Portfolio's Standard Deviation Portfolio's Standard DeviationD. C. Feasible Set of Portfolios Feasible Set of Portfolios 25% 25% 20% 20% . . 15% 15% poo poo Portfolio's Required Return Portfolio's Required Return 10% 10% 5% 5% 0% 0% 20% 40% 60% 80% 100 0% 20% 40% 60% 80% 100 0% Portfolio's Standard Deviation Portfolio's Standard Deviation If you seek a return of 10.2%, then what is the smallest standard deviation that you must accept? 0.53 %

Step by Step Solution

There are 3 Steps involved in it

1 Expert Approved Answer
Step: 1 Unlock blur-text-image
Question Has Been Solved by an Expert!

Get step-by-step solutions from verified subject matter experts

Step: 2 Unlock
Step: 3 Unlock

Students Have Also Explored These Related Accounting Questions!