

Question: Excel - Dashboard Create Age by Gender Pivot Table in Age by Gender sheet L From Master, creste ancther pivet table in a theet called
Excel - Dashboard
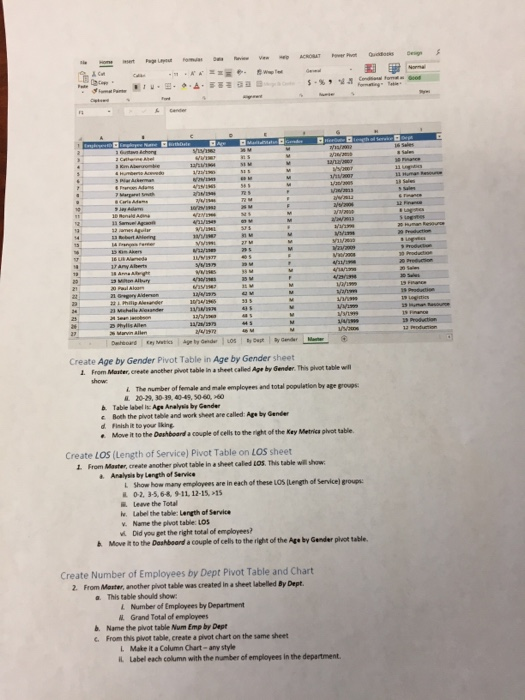
Create Age by Gender Pivot Table in Age by Gender sheet L From Master, creste ancther pivet table in a theet called Age by Gender. This plvot table wll show t. The number of female and male employees and total populetion by age groups 2029, 30-39, 40-49, 50-60, 60 &. Table label ic Age Analysis by Gender c Both the pivot table and work sheet are called: Age by Gender e Move it to the Deshboard a couple of cells to the right of the Key Metrica glvot table Create LOS (Length of Service) Pivot Table on LOS sheet From Master, create another pivot table in a sheet called LOS. This table will show aAnalysis by Length of Service Show how many employees are in each of these LOSleethofService)groups. 0-2, 3-5, 6 9-11. 12-15. Leave the Total Labe. the tableLangth o' service V. Name the plvot table: LOS i. Did you get the right total of employees? t Move it to the Dashboard a couple of cells to the right of the Age by Gender plot table Create Number of Employees by Dept Pivot Table and Chart 2 From Master, another pivot table was created in a sheet labelled By Dept L Number of Employees by Department a. This table shouild show M Grand Total of employees Name the plvot table Num Emp by Dept c. From this plvet table, create a pivot chart on the same sheet L Make it a Column Chart-any style Label each column with the number of employees in the department. Create Age by Gender Pivot Table in Age by Gender sheet L From Master, creste ancther pivet table in a theet called Age by Gender. This plvot table wll show t. The number of female and male employees and total populetion by age groups 2029, 30-39, 40-49, 50-60, 60 &. Table label ic Age Analysis by Gender c Both the pivot table and work sheet are called: Age by Gender e Move it to the Deshboard a couple of cells to the right of the Key Metrica glvot table Create LOS (Length of Service) Pivot Table on LOS sheet From Master, create another pivot table in a sheet called LOS. This table will show aAnalysis by Length of Service Show how many employees are in each of these LOSleethofService)groups. 0-2, 3-5, 6 9-11. 12-15. Leave the Total Labe. the tableLangth o' service V. Name the plvot table: LOS i. Did you get the right total of employees? t Move it to the Dashboard a couple of cells to the right of the Age by Gender plot table Create Number of Employees by Dept Pivot Table and Chart 2 From Master, another pivot table was created in a sheet labelled By Dept L Number of Employees by Department a. This table shouild show M Grand Total of employees Name the plvot table Num Emp by Dept c. From this plvet table, create a pivot chart on the same sheet L Make it a Column Chart-any style Label each column with the number of employees in the department
Step by Step Solution
There are 3 Steps involved in it

Get step-by-step solutions from verified subject matter experts