

Question: Excel File Edit View Insert Format Tools Data Window Help L ) 1 7 9 8 Sun 2 Oct 23:32 AutoSave OFF n A E
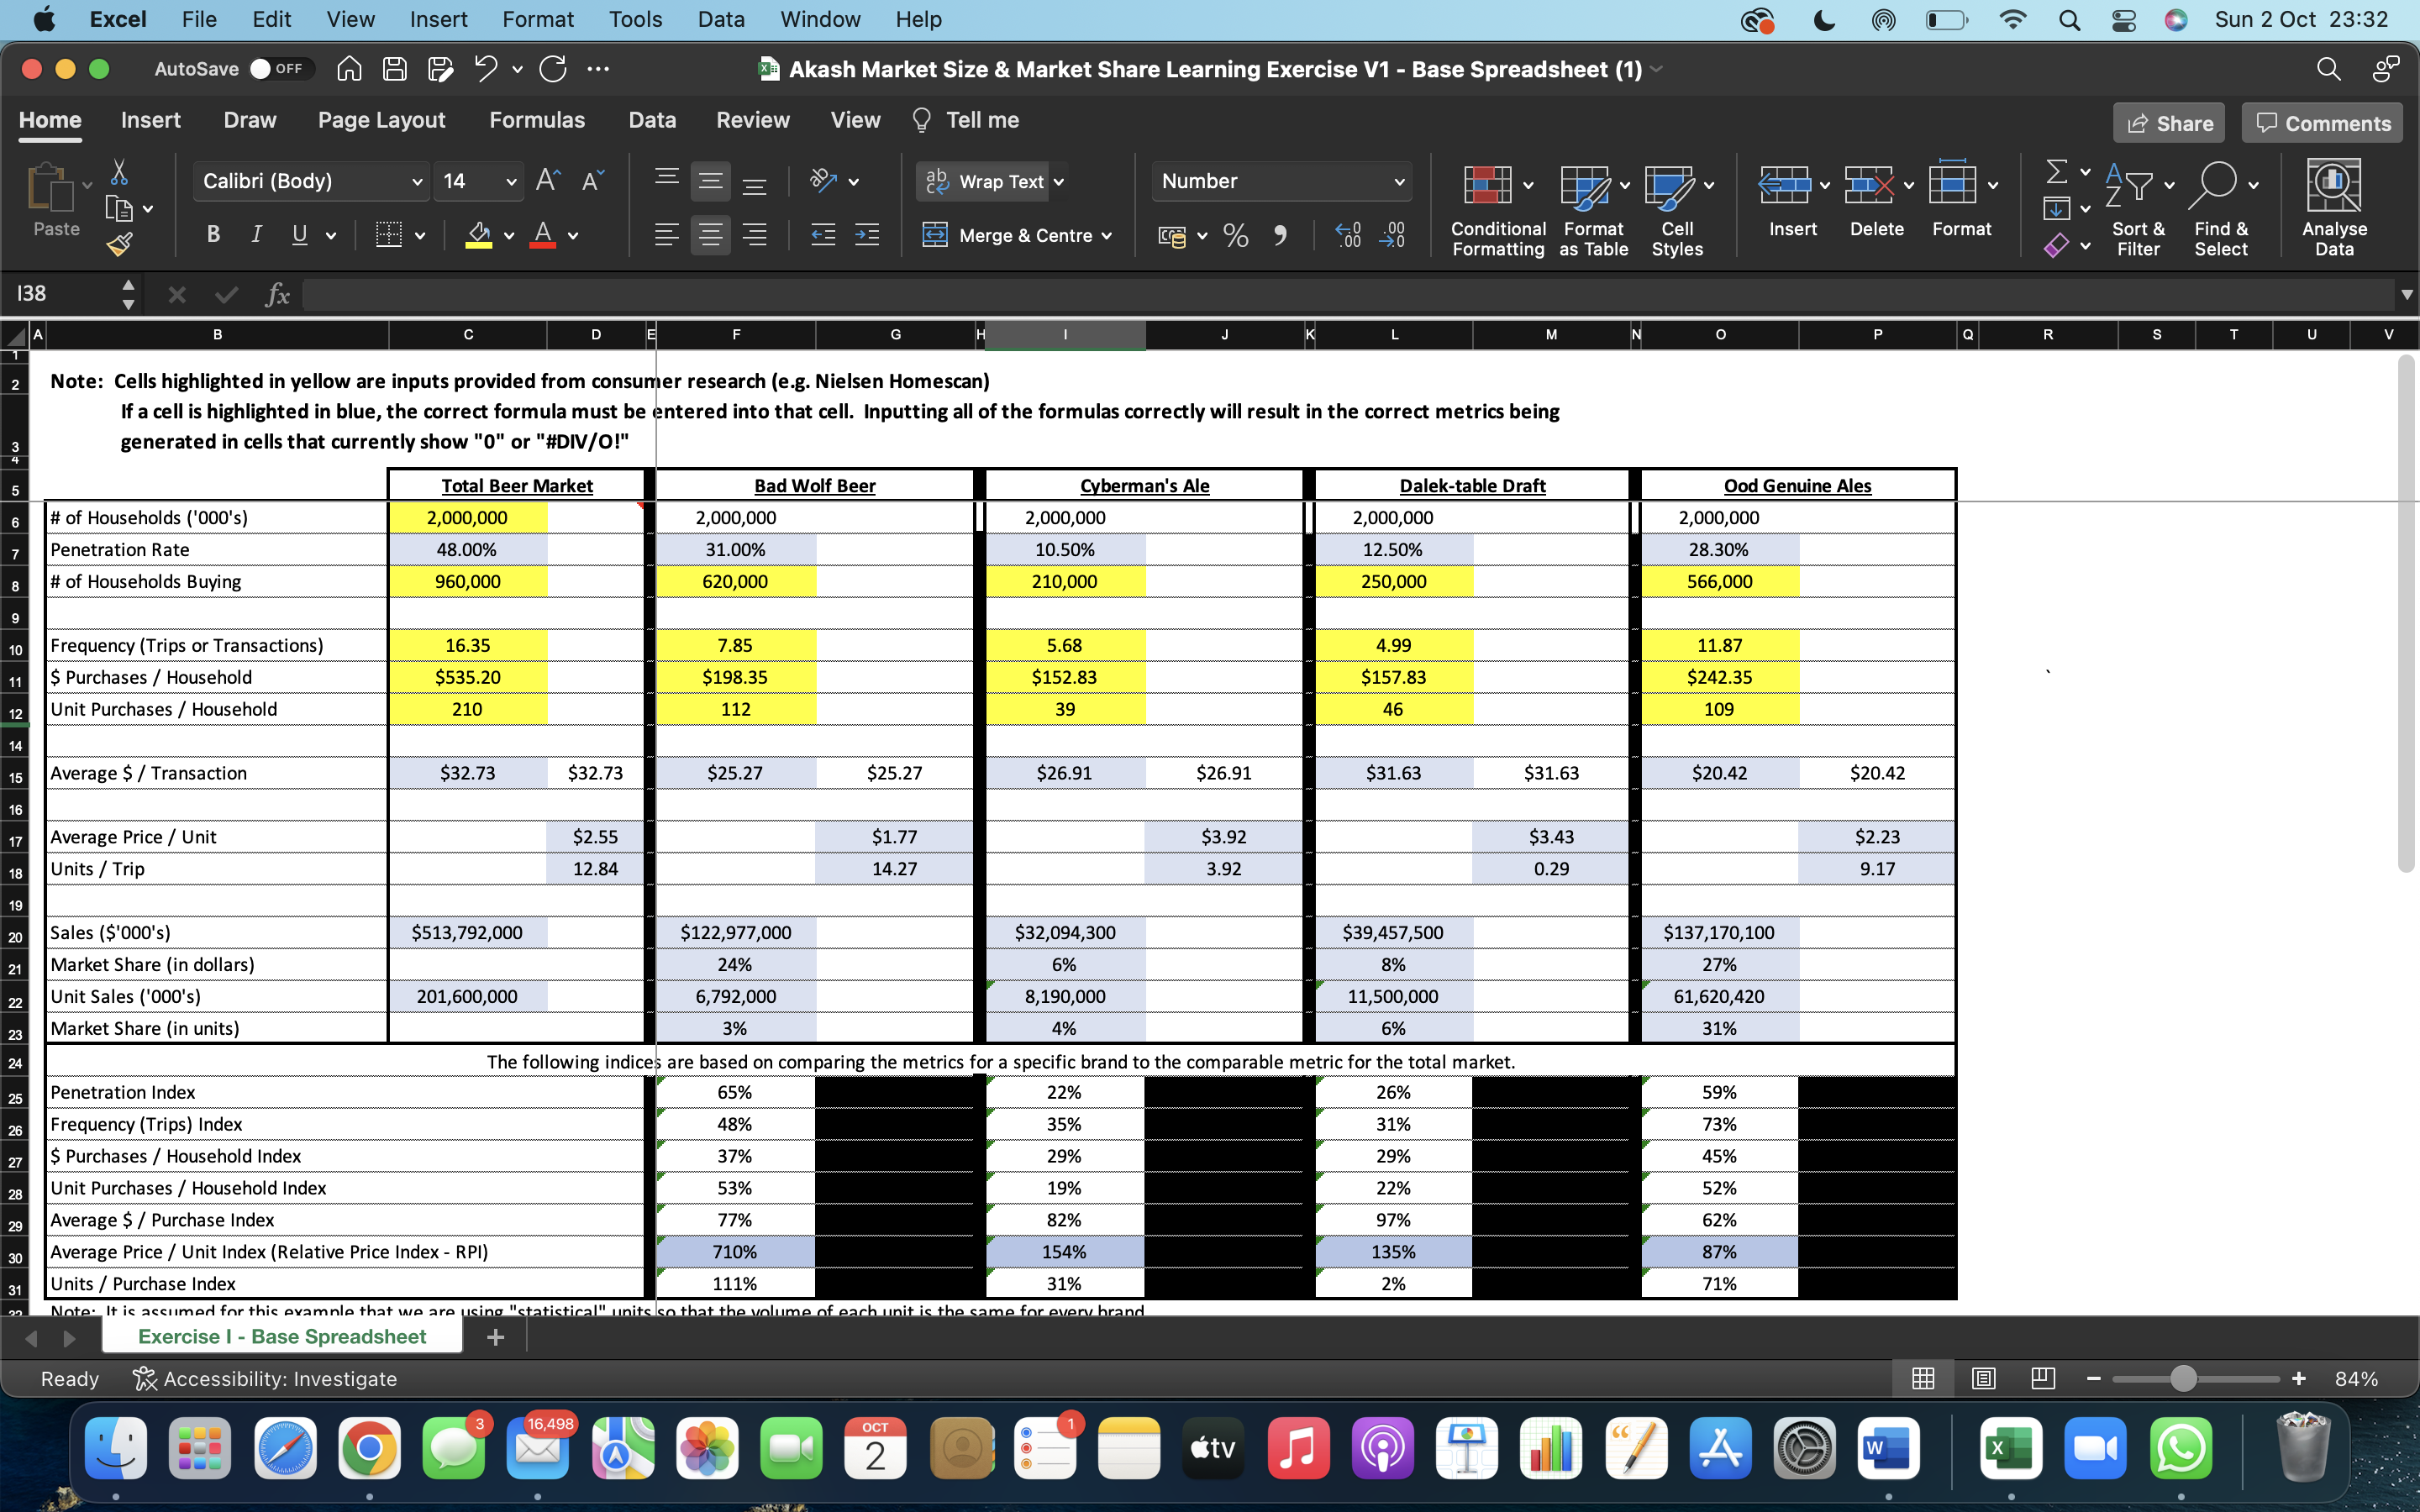
Excel File Edit View Insert Format Tools Data Window Help L ) 1 7 9 8 Sun 2 Oct 23:32 AutoSave OFF n A E ? C ... 3 Akash Market Size & Market Share Learning Exercise V1 - Base Spreadsheet (1) Q Home Insert Draw Page Layout Formulas Data Review View Tell me Share Comments Calibri (Body) 14 AA ab Wrap Text v Number J V Paste B Merge & Centre v ~ % 9 Conditional Format Cell Insert Delete Format Sort & Find & Analyse Formatting as Table Styles Filter Select Data 138 X V fx G M N O Q R S U Note: Cells highlighted in yellow are inputs provided from consumer research (e.g. Nielsen Homescan) If a cell is highlighted in blue, the correct formula must be entered into that cell. Inputting all of the formulas correctly will result in the correct metrics being generated in cells that currently show "0" or "#DIV/O!" Total Beer Market Bad Wolf Bee Cyberman's Ale Dalek-table Draft Dod Genuine Ales # of Households ('000's) 2,000,000 2,000,00 2,000,000 2,000,000 2,000,000 Penetration Rate 48.00% 31.00% 10.50% 12.50 28.30% # of Households Buying 60,000 620,000 10,000 250,000 566,000 Frequency (Trips or Transactions) 16.35 7.85 5.68 4.99 11.87 $ Purchases / Household $535.20 $198.35 $152.83 $157.83 $242.35 Unit Purchases / Household 210 112 39 46 109 Average $ / Transaction $32.73 $32.73 $25.27 $25.27 $26.91 $26.91 $31.63 $31.63 $20.42 $20.42 Average Price / Unit $2.55 $1.77 $3.92 $3.43 $2.23 Units / Trip 12.84 14.27 3.92 0.29 9.17 Sales ($'000's) $513,792,000 $122,977,000 $32,094,300 $39,457,500 $137,170,100 Market Share (in dollars) 24% 6% 8% 27% Unit Sales ('000's) 201,600,000 6,792,000 3,190,000 11,500,000 61,620,420 Market Share (in units) 3% 4% 6% 31% The following indices are based on comparing the metrics for a specific brand to the comparable metric for the total market Penetration In 65% 22% 26% 59% Frequency (Trips) Index 48% 35% 31% 73% $ Purchases / Household Index 37% 29% 29% 45% Unit Purchases / Household Index 53% 19% 22% 52% Average $ / Purchase Index 77% 82% 97% 62% Average Price / Unit Index (Relative Price Index - RPI) 710% 154% 135% 37% Units / Purchase Index 111% 31% 2% 71% Note: It is accumed for this evamnle that we are using "statistical" units so that the volume of each unit is the same for every brand Exercise I - Base Spreadsheet + Ready Ex Accessibility: Investigate + 84% 16,498 OCT 2
Step by Step Solution
There are 3 Steps involved in it

Get step-by-step solutions from verified subject matter experts