

Question: EXCEL Formula Help Needed! I am trying to create a table that displays using the following: Normal Retirement Age: 65 Retirement Eligibility : Age 55
EXCEL Formula Help Needed!
I am trying to create a table that displays using the following: Normal Retirement Age: 65 Retirement Eligibility : Age 55 with 10 years of employment Normal Retirement Benefit : 3% * average salary * service, payable at age 65 Early Retirement Reduction: 4% reduction for each year that the retirement is before age 65 Late Retirement Benefit: 5% increase for each year after the retirement after age 65 How do you create an excel formula to fill a table similar to the image below? 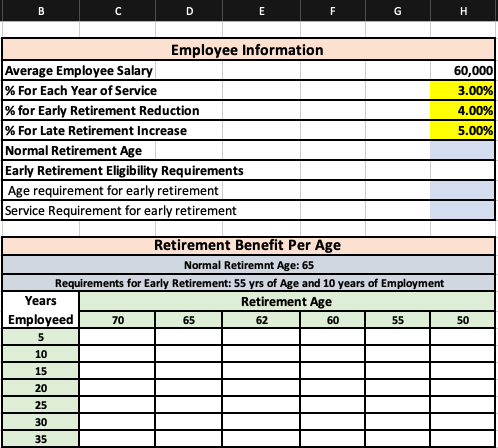
\begin{tabular}{|c|c|c|c|c|c|c|} \hline \multicolumn{7}{|c|}{ Retirement Benefit Per Age } \\ \hline \multicolumn{6}{|c|}{ Normal Retiremnt Age: 65} \\ \hline \multicolumn{6}{|c|}{ Requirements for Early Retirement: 55 yrs of Age and 10 years of Employment } \\ \hline Years & \multicolumn{5}{|c|}{ Retirement Age } \\ \cline { 2 - 8 } Employeed & 70 & 65 & 62 & 60 & 55 & 50 \\ \hline 5 & & & & & & \\ \hline 10 & & & & & & \\ \hline 15 & & & & & & \\ \hline 20 & & & & & & \\ \hline 25 & & & & & & \\ \hline 30 & & & & & & \\ \hline 35 & & & & & & \\ \hline \end{tabular} \begin{tabular}{|c|c|c|c|c|c|c|} \hline \multicolumn{7}{|c|}{ Retirement Benefit Per Age } \\ \hline \multicolumn{6}{|c|}{ Normal Retiremnt Age: 65} \\ \hline \multicolumn{6}{|c|}{ Requirements for Early Retirement: 55 yrs of Age and 10 years of Employment } \\ \hline Years & \multicolumn{5}{|c|}{ Retirement Age } \\ \cline { 2 - 8 } Employeed & 70 & 65 & 62 & 60 & 55 & 50 \\ \hline 5 & & & & & & \\ \hline 10 & & & & & & \\ \hline 15 & & & & & & \\ \hline 20 & & & & & & \\ \hline 25 & & & & & & \\ \hline 30 & & & & & & \\ \hline 35 & & & & & & \\ \hline \end{tabular}
Step by Step Solution
There are 3 Steps involved in it

Get step-by-step solutions from verified subject matter experts