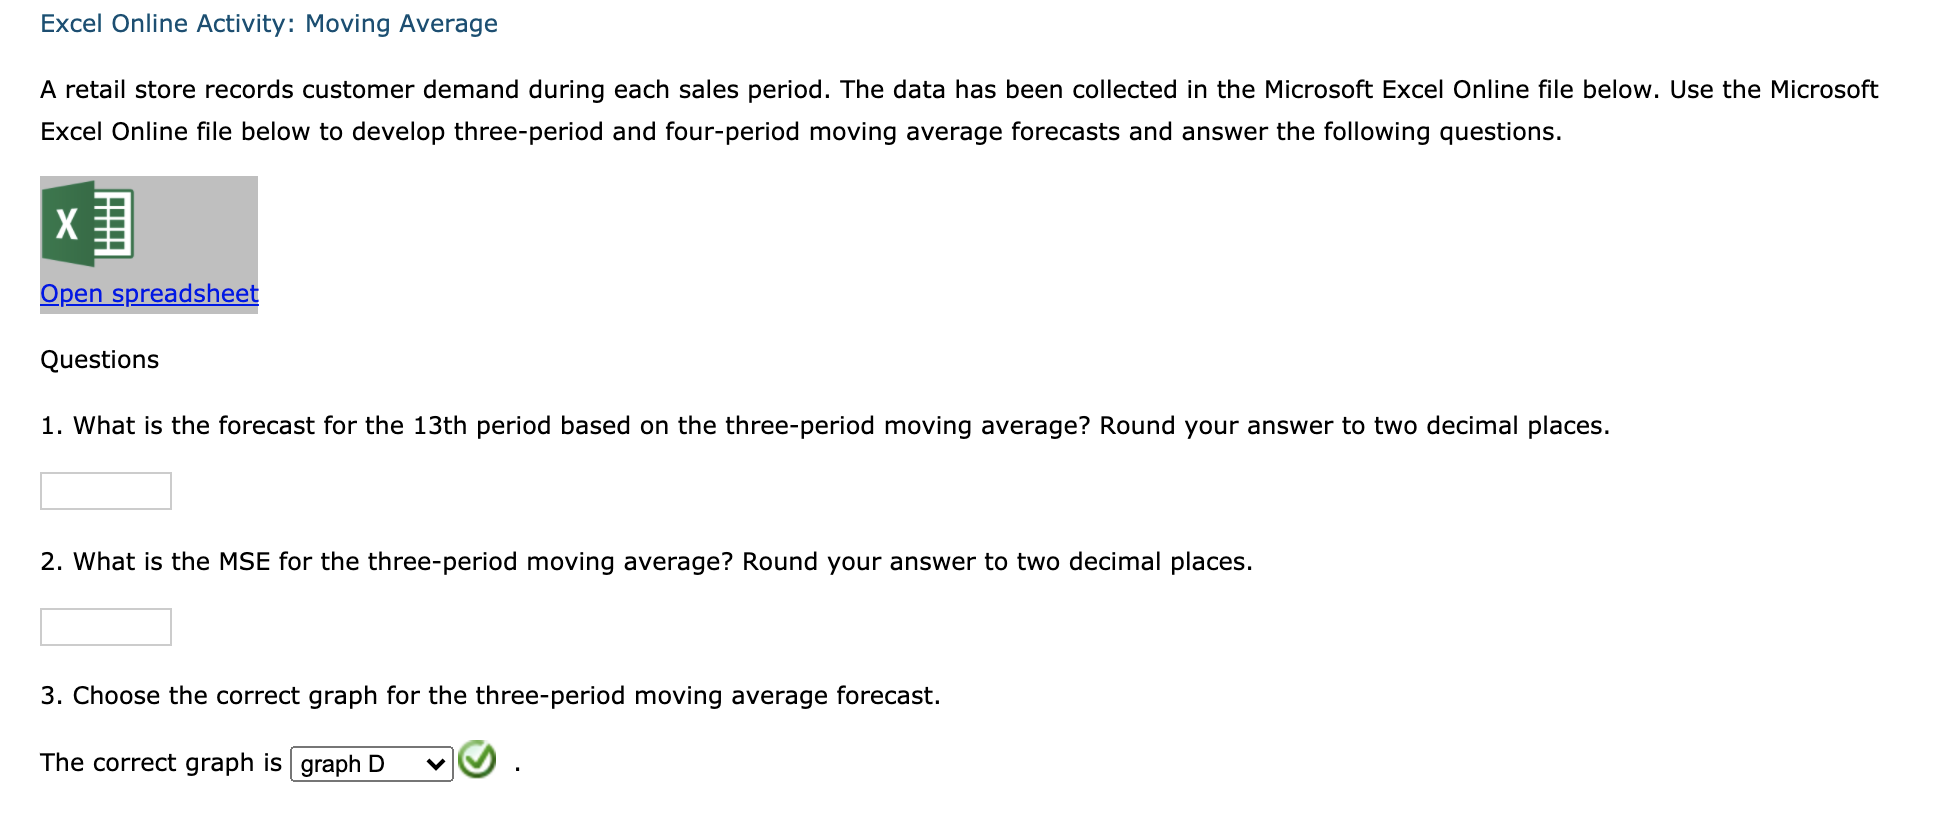
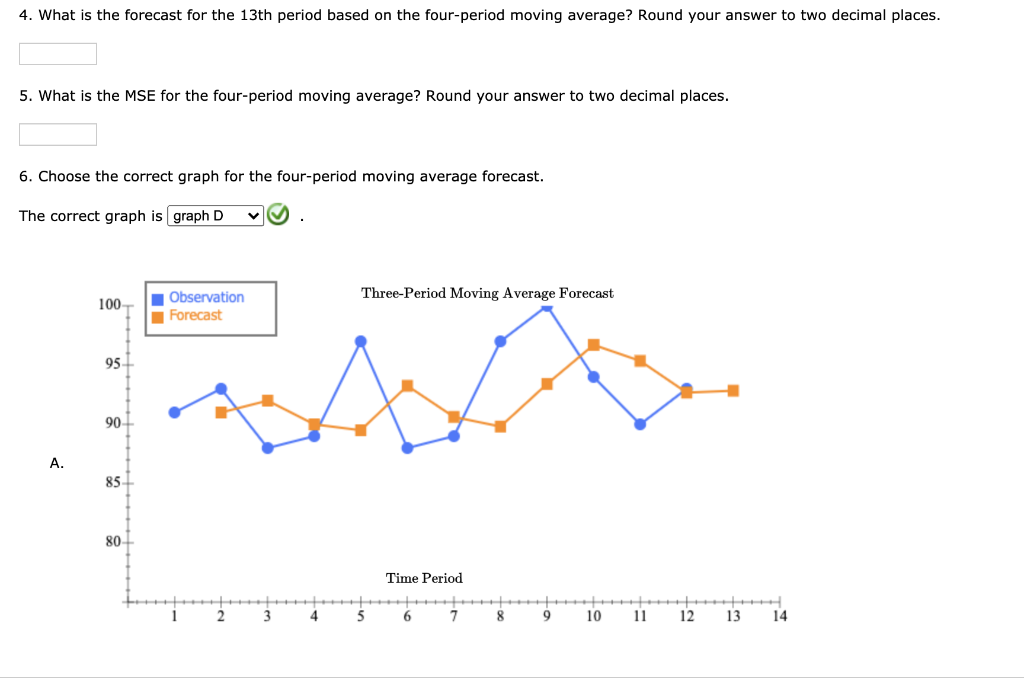
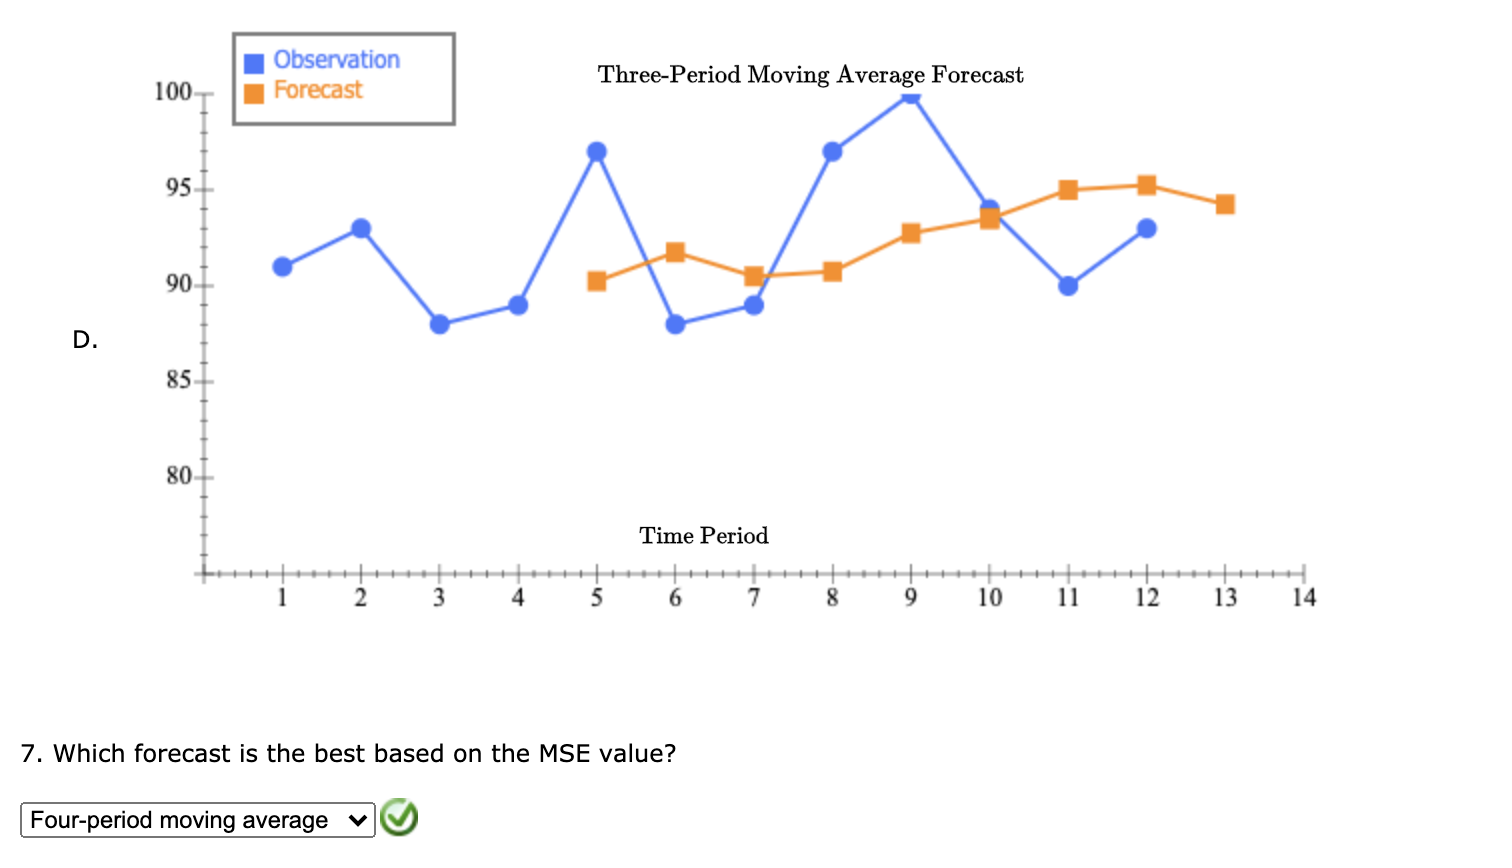
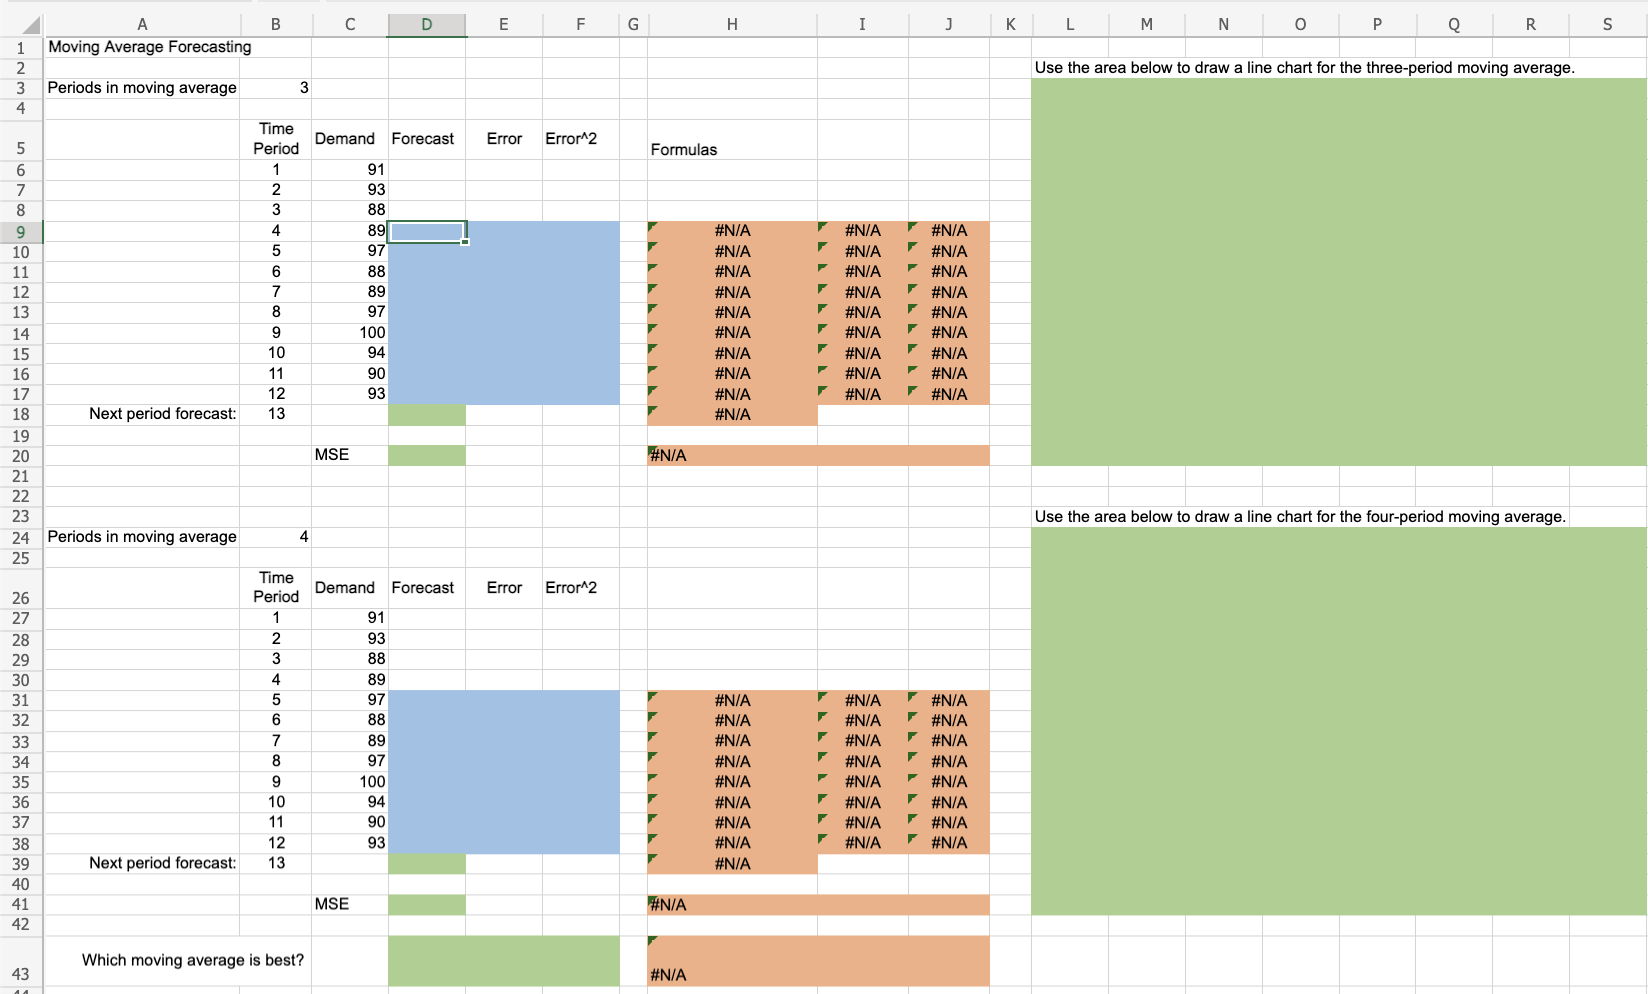
Question: Excel Online Activity: Moving Average A retail store records customer demand during each sales period. The data has been collected in the Microsoft Excel Online

Excel Online Activity: Moving Average A retailExcel Online Activity: Moving Average A retail

Excel Online Activity: Moving Average A retailExcel Online Activity: Moving Average A retailExcel Online Activity: Moving Average A retailExcel Online Activity: Moving Average A retail

Excel Online Activity: Moving Average A retail store records customer demand during each sales period. The data has been collected in the Microsoft Excel Online file below. Use the Microsoft Excel Online file below to develop three-period and four-period moving average forecasts and answer the following questions. Open spreadsheet Questions 1. What is the forecast for the 13th period based on the three-period moving average? Round your answer to two decimal places. 2. What is the MSE for the three-period moving average? Round your answer to two decimal places. 3. Choose the correct graph for the three-period moving average forecast. The correct graph is graph D 4. What is the forecast for the 13th period based on the four-period moving average? Round your answer to two decimal places. 5. What is the MSE for the four-period moving average? Round your answer to two decimal places. 6. Choose the correct graph for the four-period moving average forecast. The correct graph is graph D Three-Period Moving Average Forecast 100 Observation Forecast 95 90+ A. 85 80 Time Period 1 2 3 4 5 6 7 8 9 10 11 12 13 14 Three-Period Moving Average Forecast 100 Observation Forecast 95 ta 90 B. 85 80 Time Period 3 4 5 6 7 8 9 10 11 12 13 14 Three-Period Moving Average Forecast 100 Observation Forecast 95 90 FA C. 85 80 Time Period 2 3 4 5 6 7 8 9 10 11 12 13 14 Observation Forecast Three-Period Moving Average Forecast 100 95 90 D. 85 80 Time Period 2 3 4 6 7 8 9 10 11 12 13 14 7. Which forecast is the best based on the MSE value? Four-period moving average E F G H I J K L M N o P Q R S Use the area below to draw a line chart for the three-period moving average. Error Error2 Formulas #N/A #N/A #N/A #N/A #N/A #N/A #N/A #N/A #N/A #N/A #N/A #N/A #N/A #N/A #N/A #N/A #N/A #N/A #N/A #N/A #N/A #N/A #N/A #N/A #N/A #N/A #N/A #N/A #N/A A B D 1 Moving Average Forecasting 2 3 Periods in moving average 3 4 Time Demand Forecast 5 Period 6 1 91 7 2 93 8 3 88 4 89 9 10 5 97 11 6 88 12 7 89 13 8 97 9 100 14 15 10 94 16 11 90 17 12 93 18 Next period forecast: 13 19 MSE 20 21 22 23 4 24 Periods in moving average 25 Time Demand Forecast 26 Period 27 1 91 28 2 93 29 3 88 30 4 89 31 5 97 32 6 88 33 7 89 8 97 34 35 9 100 36 10 94 37 11 90 38 12 93 39 Next period forecast: 13 40 41 MSE 42 Use the area below to draw a line chart for the four-period moving average. Error Error2 #N/A #N/A #N/A #N/A #N/A #N/A #N/A #N/A #N/A #N/A #N/A #N/A #N/A #N/A #N/A #N/A #N/A #N/A #N/A #N/A #N/A #N/A #N/A #N/A #N/A #N/A Which moving average is best? 43 #N/A

Step by Step Solution

There are 3 Steps involved in it

1 Expert Approved Answer
Step: 1 Unlock blur-text-image
Question Has Been Solved by an Expert!

Get step-by-step solutions from verified subject matter experts

Step: 2 Unlock
Step: 3 Unlock

Students Have Also Explored These Related General Management Questions!