

Question: Smoothing Excel Activity Excel Online Activity: Exponential Smoothing A retail store records customer demand during each sales period. The data has been collected in the
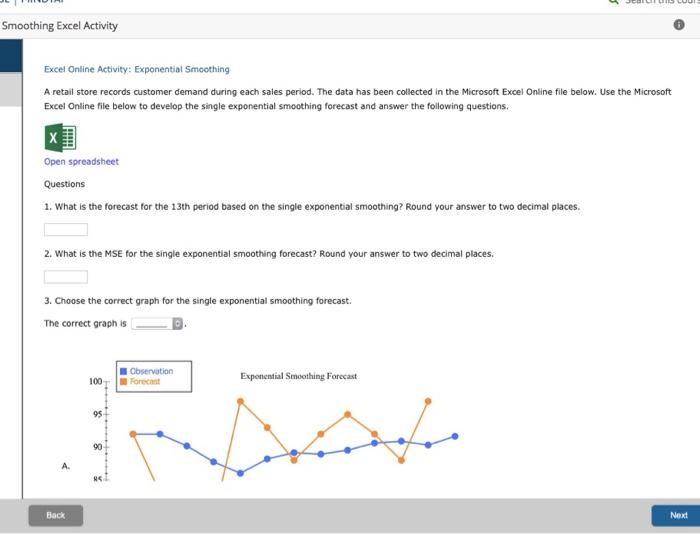
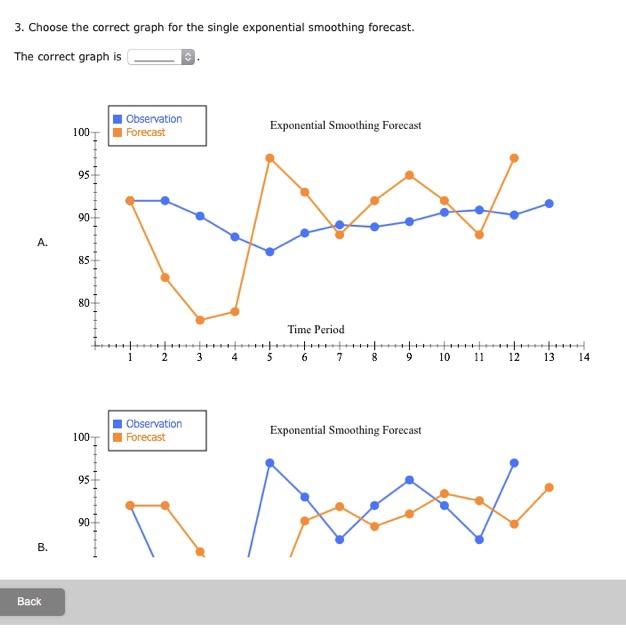
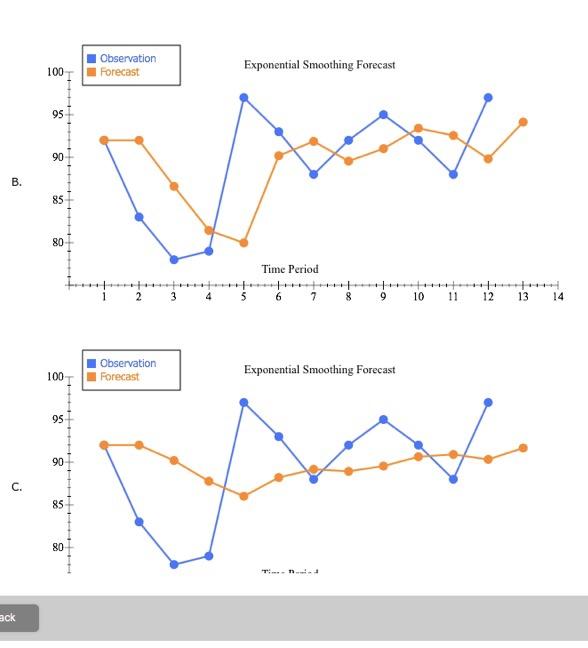
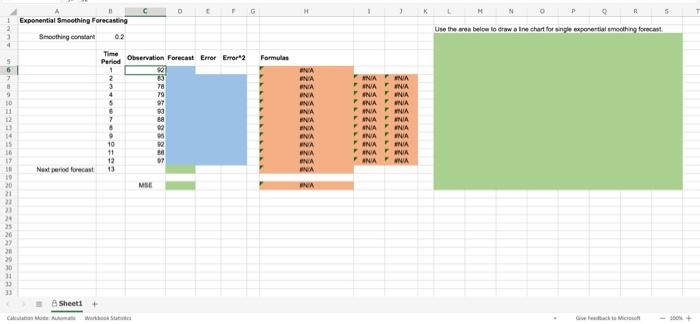
Smoothing Excel Activity Excel Online Activity: Exponential Smoothing A retail store records customer demand during each sales period. The data has been collected in the Microsoft Excel Online file below. Use the Microsoft Excel Online file below to develop the single exponential smoothing forecast and answer the following questions. Open spreadsheet Questions 1. What is the forecast for the 13th period based on the single exponential smoothing? Round your answer to two decimal places. 2. What is the MSE for the single exponential smoothing forecast? Round your answer to two decimal places. 3. Choose the correct graph for the single exponential smoothing forecast The correct graph is 100 Observation Forecast Exponential Smoothing Forecast 95 90 Back Next 100 Observation Forecast Exponential Smoothing Forecast 95 90 pot B. 85 80 Time Period 6 7 8 9 10 11 12 13 14 100 Observation Forecast Exponential Smoothing Forecast 95 90 c. 85 80 ack Smoothing Excel Activity Excel Online Activity: Exponential Smoothing A retail store records customer demand during each sales period. The data has been collected in the Microsoft Excel Online file below. Use the Microsoft Excel Online file below to develop the single exponential smoothing forecast and answer the following questions. Open spreadsheet Questions 1. What is the forecast for the 13th period based on the single exponential smoothing? Round your answer to two decimal places. 2. What is the MSE for the single exponential smoothing forecast? Round your answer to two decimal places. 3. Choose the correct graph for the single exponential smoothing forecast The correct graph is 100 Observation Forecast Exponential Smoothing Forecast 95 90 Back Next 100 Observation Forecast Exponential Smoothing Forecast 95 90 pot B. 85 80 Time Period 6 7 8 9 10 11 12 13 14 100 Observation Forecast Exponential Smoothing Forecast 95 90 c. 85 80 ack
Step by Step Solution
There are 3 Steps involved in it

Get step-by-step solutions from verified subject matter experts