

Question: Use the area below to draw a line chart for the three-period moving a Use the area below to draw a line chart for the
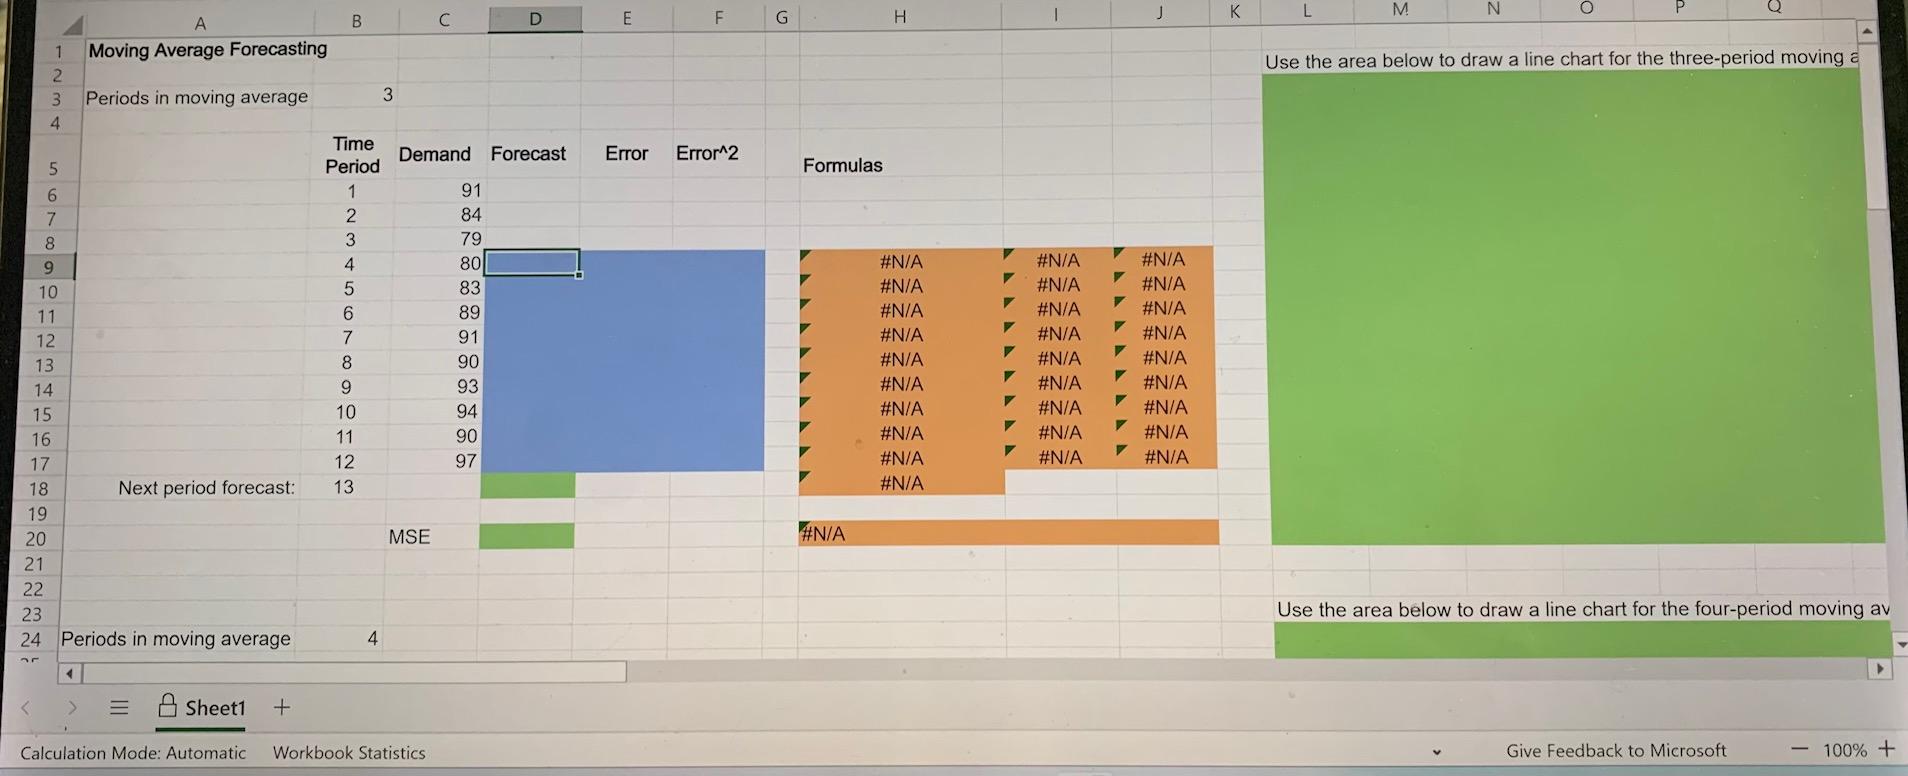
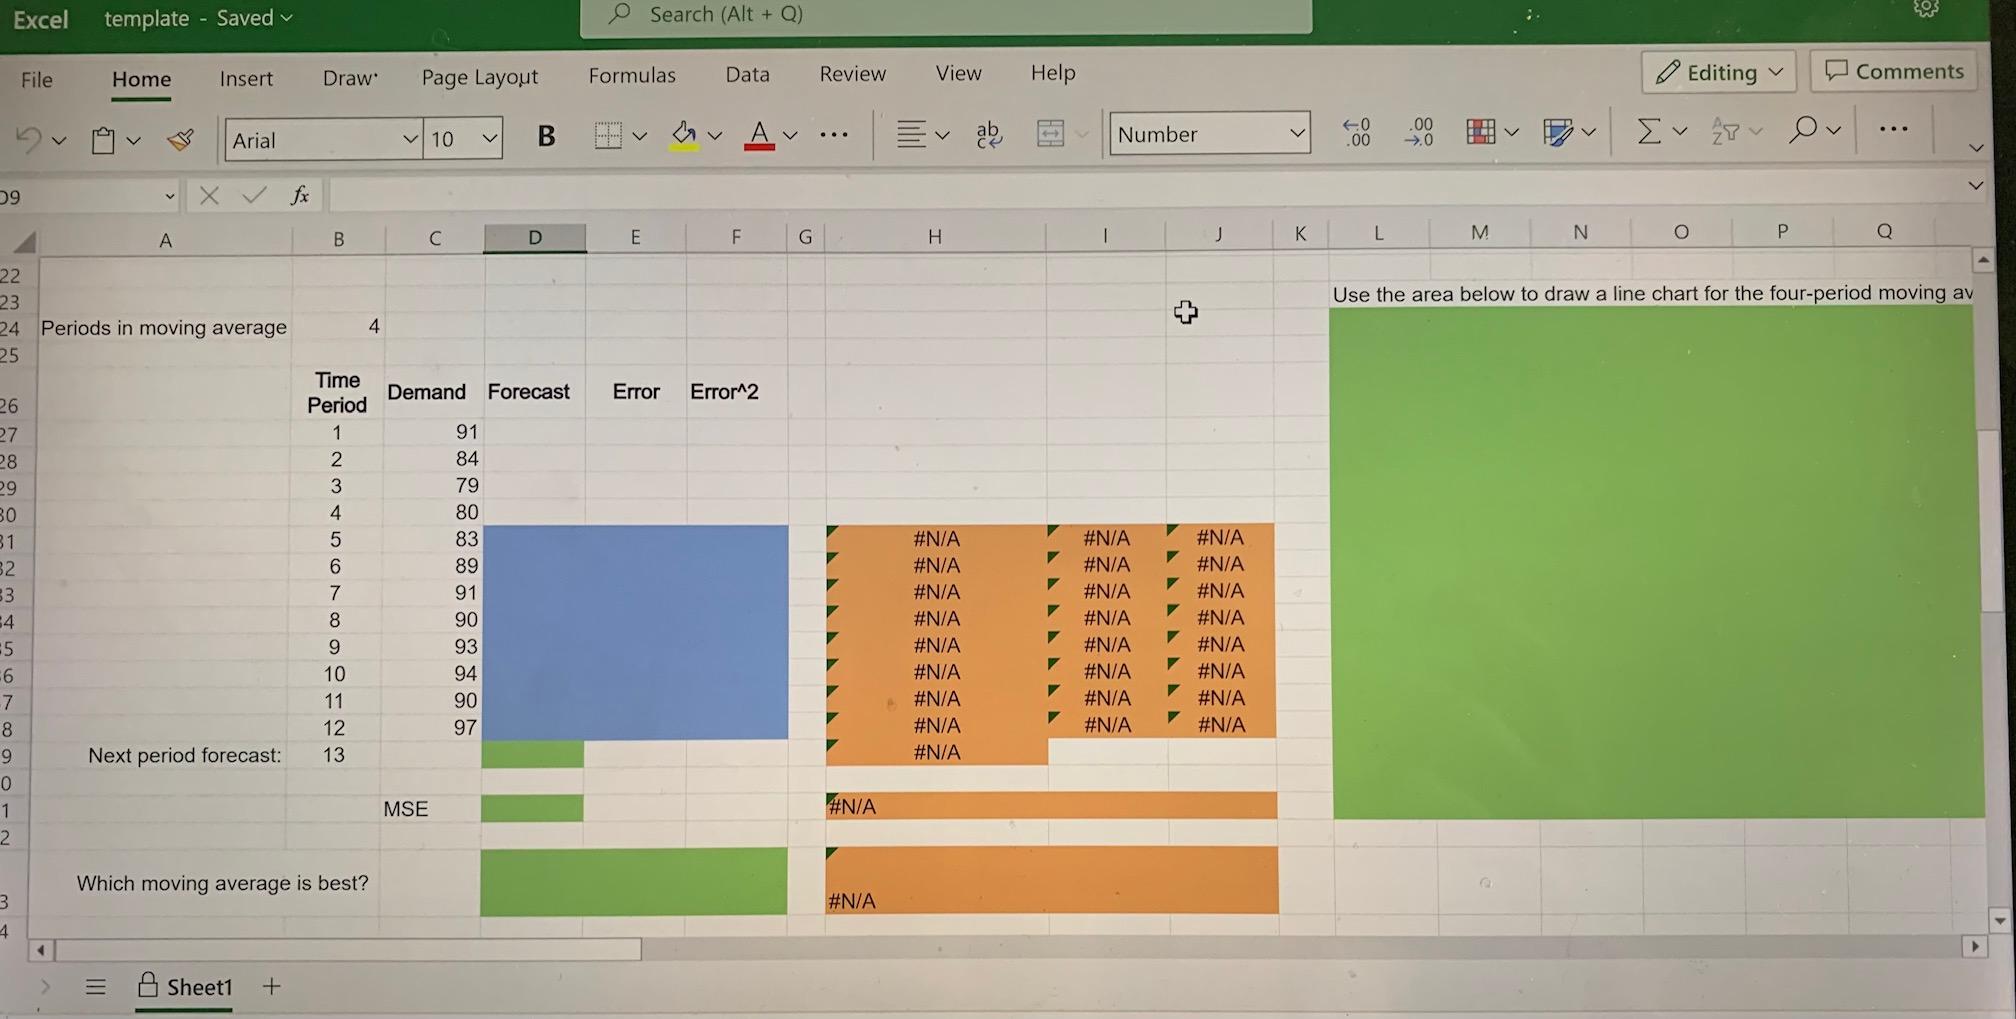
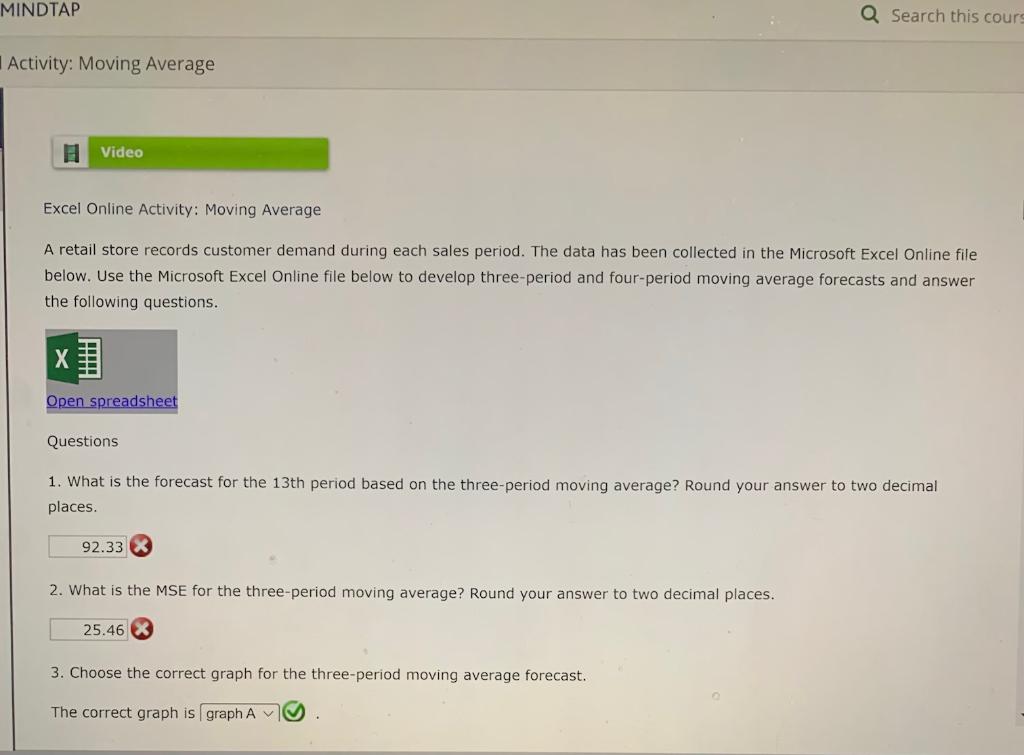
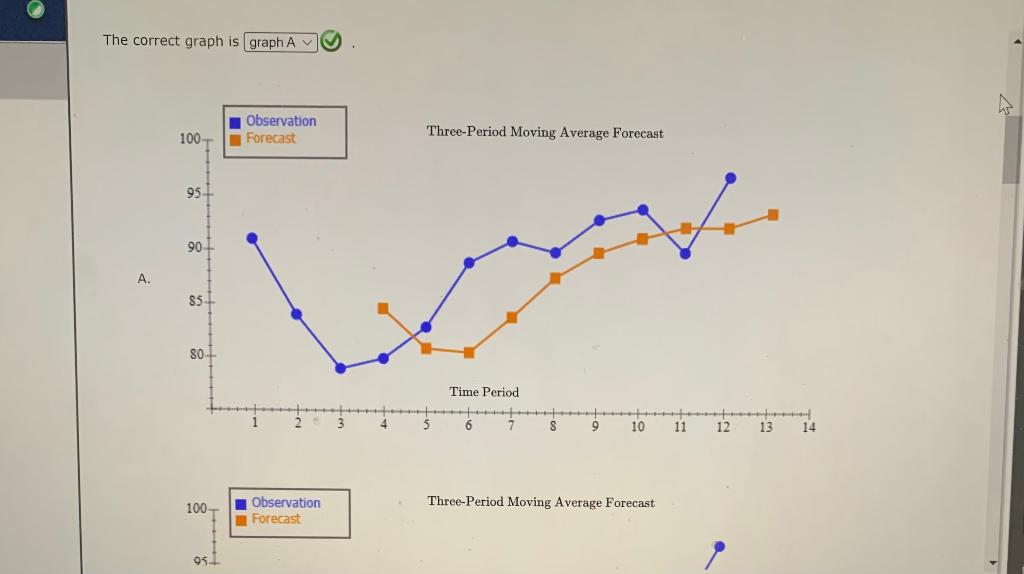
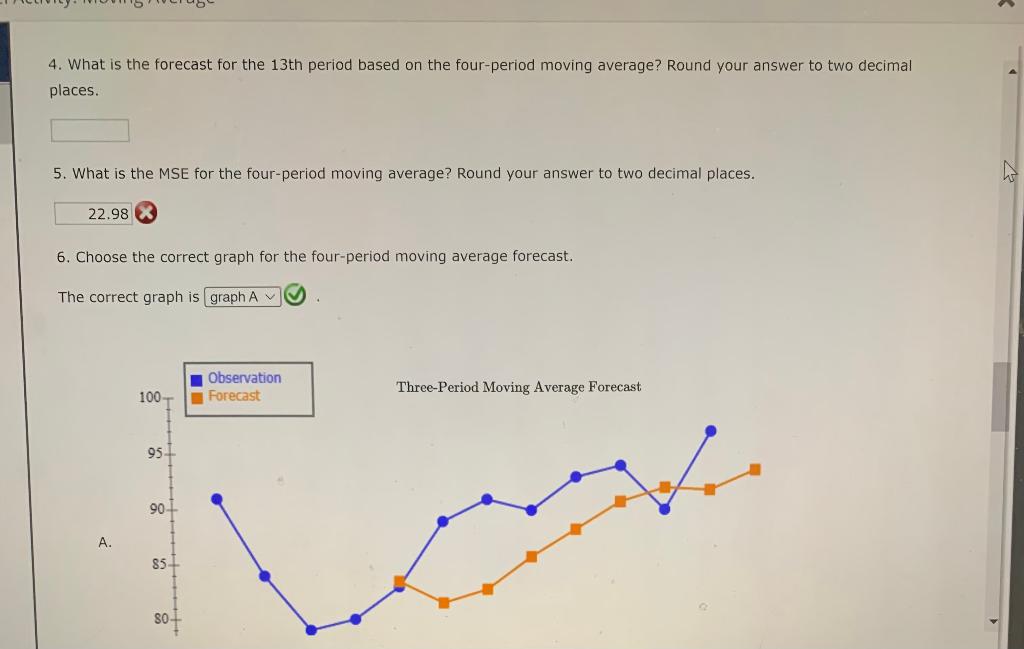
Use the area below to draw a line chart for the three-period moving a Use the area below to draw a line chart for the four-period moving av Excel Online Activity: Moving Average A retail store records customer demand during each sales period. The data has been collected in the Microsoft Excel Online file below. Use the Microsoft Excel Online file below to develop three-period and four-period moving average forecasts and answer the following questions. Questions 1. What is the forecast for the 13th period based on the three-period moving average? Round your answer to two decimal places. 2. What is the MSE for the three-period moving average? Round your answer to two decimal places. 3. Choose the correct graph for the three-period moving average forecast. The correct graph is The correct graph is 4. What is the forecast for the 13th period based on the four-period moving average? Round your answer to two decimal places. 5. What is the MSE for the four-period moving average? Round your answer to two decimal places. 6. Choose the correct graph for the four-period moving average forecast. The correct graph is Use the area below to draw a line chart for the three-period moving a Use the area below to draw a line chart for the four-period moving av Excel Online Activity: Moving Average A retail store records customer demand during each sales period. The data has been collected in the Microsoft Excel Online file below. Use the Microsoft Excel Online file below to develop three-period and four-period moving average forecasts and answer the following questions. Questions 1. What is the forecast for the 13th period based on the three-period moving average? Round your answer to two decimal places. 2. What is the MSE for the three-period moving average? Round your answer to two decimal places. 3. Choose the correct graph for the three-period moving average forecast. The correct graph is The correct graph is 4. What is the forecast for the 13th period based on the four-period moving average? Round your answer to two decimal places. 5. What is the MSE for the four-period moving average? Round your answer to two decimal places. 6. Choose the correct graph for the four-period moving average forecast. The correct graph is
Step by Step Solution
There are 3 Steps involved in it

Get step-by-step solutions from verified subject matter experts