

Question: Executives at The Thinking Channel have decided to test whether the educational backgrounds of the channel's viewers are different from the educational backgrounds of
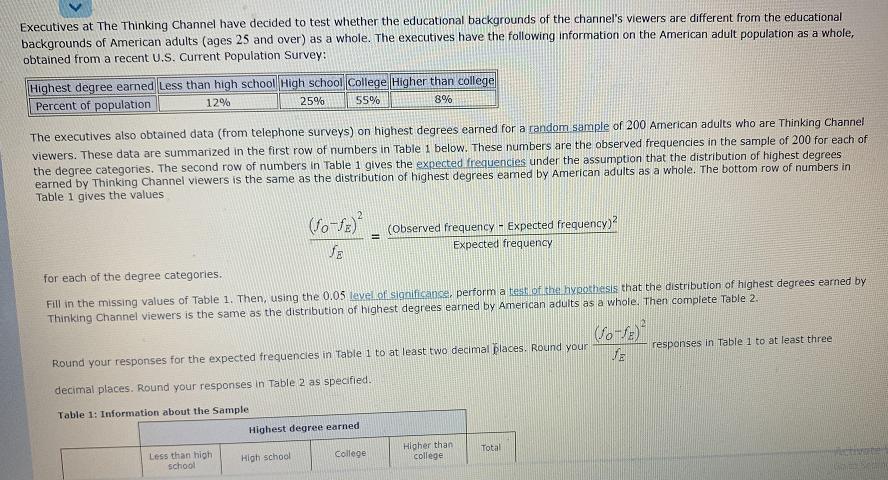
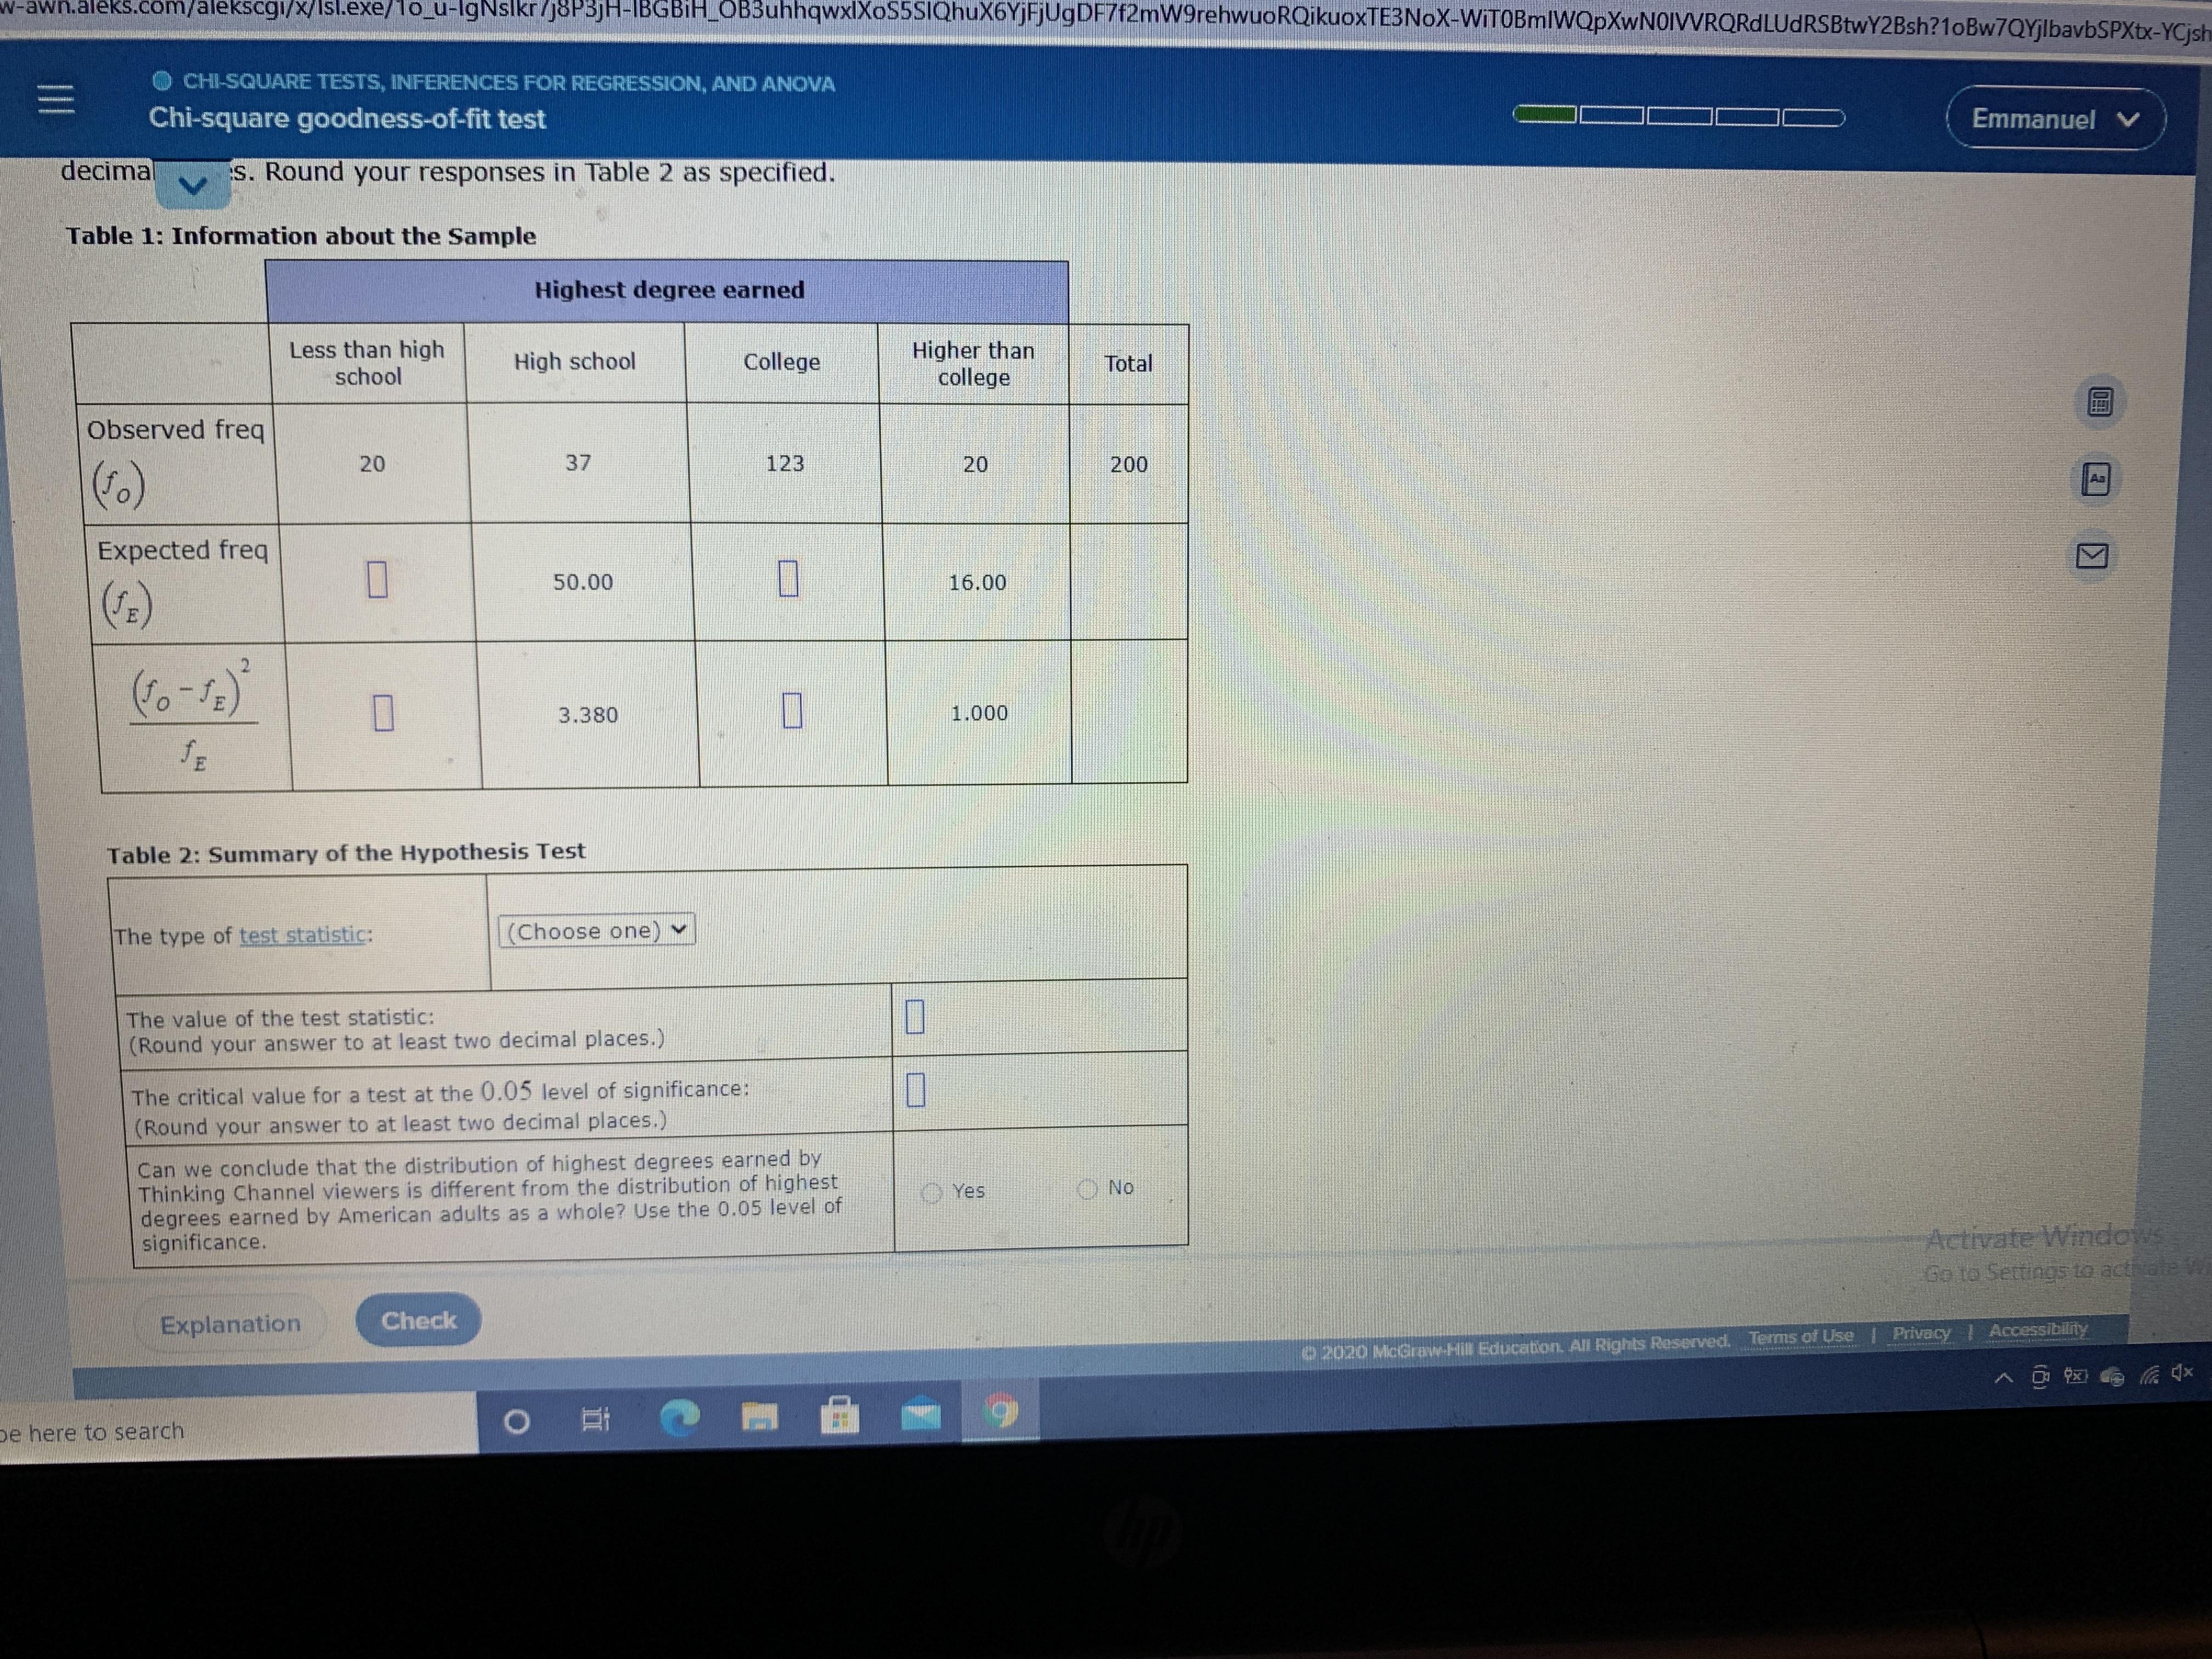
Executives at The Thinking Channel have decided to test whether the educational backgrounds of the channel's viewers are different from the educational backgrounds of American adults (ages 25 and over) as a whole. The executives have the following information on the American adult population as a whole, obtained from a recent U.S. Current Population Survey: Highest degree earned Less than high school High school College Higher than college Percent of population 12% 25% 55% 8% The executives also obtained data (from telephone surveys) on highest degrees earned for a random sample of 200 American adults who are Thinking Channel viewers. These data are summarized in the first row of numbers in Table 1 below. These numbers are the observed frequencies in the sample of 200 for each of the degree categories. The second row of numbers in Table 1 gives the expected frequencies under the assumption that the distribution of highest degrees earned by Thinking Channel viewers is the same as the distribution of highest degrees eamed by American adults as a whole. The bottom row of numbers in Table 1 gives the values (Observed frequency - Expected frequency)? %3D Expected frequency for each of the degree categories. Fill in the missing values of Table 1. Then, using the 0.05 level of significance, perform a test of the hypothesis that the distribution of highest degrees earned by Thinking Channel viewers is the same as the distribution of highest degrees earned by American adults as a whole. Then complete Table 2. Round your responses for the expected frequencies in Table 1 to at least two decimal places. Round your responses in Table 1 to at least three decimal places. Round your responses in Table 2 as specified. Table 1: Information about the Sample Highest degree earned Less than high school Higher than college High school College Total w-awn.aleks.com/alekscg/x/Isl.exe/1o_u-lgNslkr/J8P3JH-IBGBIH_OB3uhhqwxlXoSSSIQhuX6YjFjUgDF/f2mW9rehwuoRQikuoxTE3NoX-WITOBmlWQpXwNOIVVRORdLUdRSBtwY2Bsh?1oBw7QYjlbavbSPXtx-YCjsh O CHI-SQUARE TESTS, INFERENCES FOR REGRESSION, AND ANOVA Chi-square goodness-of-fit test Emmanuel decimal s. Round your responses in Table 2 as specified. Table 1: Information about the Sample Highest degree earned Less than high school Higher than college High school College Total Observed freq 20 37 123 20 200 Expected freq 50.00 16.00 3.380 1.000 SE Table 2: Summary of the Hypothesis Test The type of test statistic: (Choose one) The value of the test statistic: (Round your answer to at least two decimal places.) The critical value for a test at the 0.05 level of significance: (Round your answer to at least two decimal places.) Can we conclude that the distribution of highest degrees earned by Thinking Channel viewers is different from the distribution of highest degrees earned by American adults as a whole? Use the 0.05 level of significance. O Yes O No Activate Windows Go to Settings to actiate W Explanation Check Accessibility 2020 McGraw-Hill Education. All Rights Reserved. Terms of Use Privacy De here to search
Step by Step Solution
3.52 Rating (162 Votes )
There are 3 Steps involved in it

Get step-by-step solutions from verified subject matter experts