Question: Exercise 1. Develop an Excel LP model of the following problem and solve it. Dan and Joel own a retro game shop, and one of
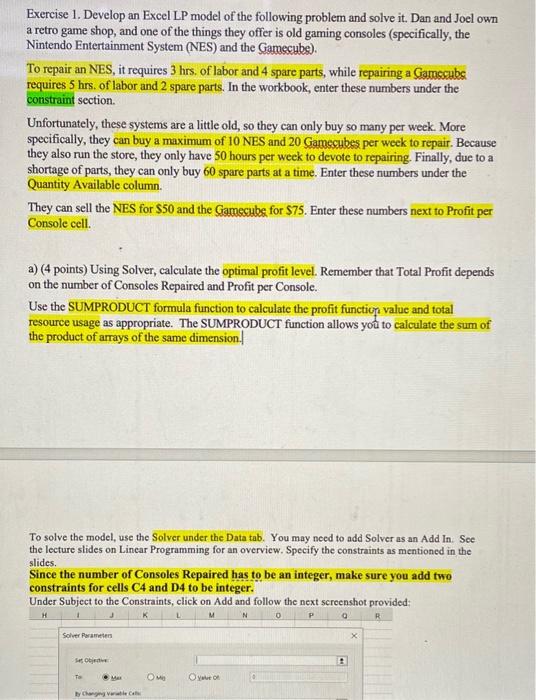
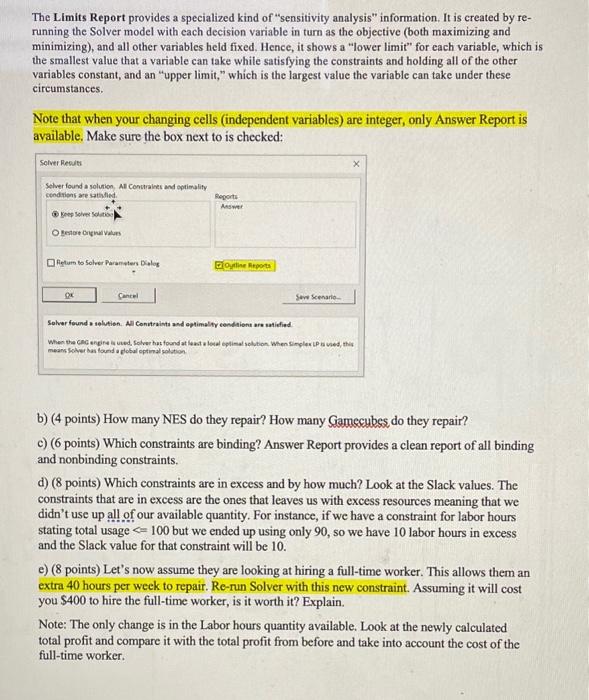
Exercise 1. Develop an Excel LP model of the following problem and solve it. Dan and Joel own a retro game shop, and one of the things they offer is old gaming consoles (specifically, the Nintendo Entertainment System (NES) and the Gamecube). To repair an NES, it requires 3 hrs. of labor and 4 spare parts, while repairing a Gamesube requires 5hrs. of labor and 2 spare parts. In the workbook, enter these numbers under the constraint section. Unfortunately, these systems are a little old, so they can only buy so many per week. More specifically, they can buy a maximum of 10 NES and 20 Gamecubes per week to repair. Because they also run the store, they only have 50 hours per week to devote to repairing. Finally, due to a shortage of parts, they can only buy 60 spare parts at a time. Enter these numbers under the Quantity Available column. They can sell the NES for $50 and the Gamecube for $75. Enter these numbers next to Profit per Console cell. a) (4 points) Using Solver, calculate the optimal profit level. Remember that Total Profit depends on the number of Consoles Repaired and Profit per Console. Use the SUMPRODUCT formula function to calculate the profit functiop value and total resource usage as appropriate. The SUMPRODUCT function allows you to calculate the sum of the product of arrays of the same dimension.| To solve the model, use the Solver under the Data tab. You may need to add Solver as an Add In. See the lecture slides on Linear Programming for an overview. Specify the constraints as mentioned in the slides. Since the number of Consoles Repaired has to be an integer, make sure you add two constraints for cells C4 and D4 to be integer. Under Subject to the Constraints, click on Add and follow the next screenshot provided: The Limits Report provides a specialized kind of "sensitivity analysis" information. It is created by rerunning the Solver model with each decision variable in turn as the objective (both maximizing and minimizing), and all other variables held fixed. Hence, it shows a "lower limit" for each variable, which is the smallest value that a variable can take while satisfying the constraints and holding all of the other variables constant, and an "upper limit," which is the largest value the variable can take under these circumstances. Note that when your changing cells (independent variables) are integer, only Answer Report is available. Make sure the box next to is checked: b) (4 points) How many NES do they repair? How many Gamecubes do they repair? c) ( 6 points) Which constraints are binding? Answer Report provides a clean report of all binding and nonbinding constraints. d) (8 points) Which constraints are in excess and by how much? Look at the Slack values. The constraints that are in excess are the ones that leaves us with excess resources meaning that we didn't use up all of our available quantity. For instance, if we have a constraint for labor hours stating total usage