

Question: Exercise 1: We use linear regression to predict house price per unit (10000 New Taiwan Dollar/Ping, where Ping is a local unit, 1 Ping =

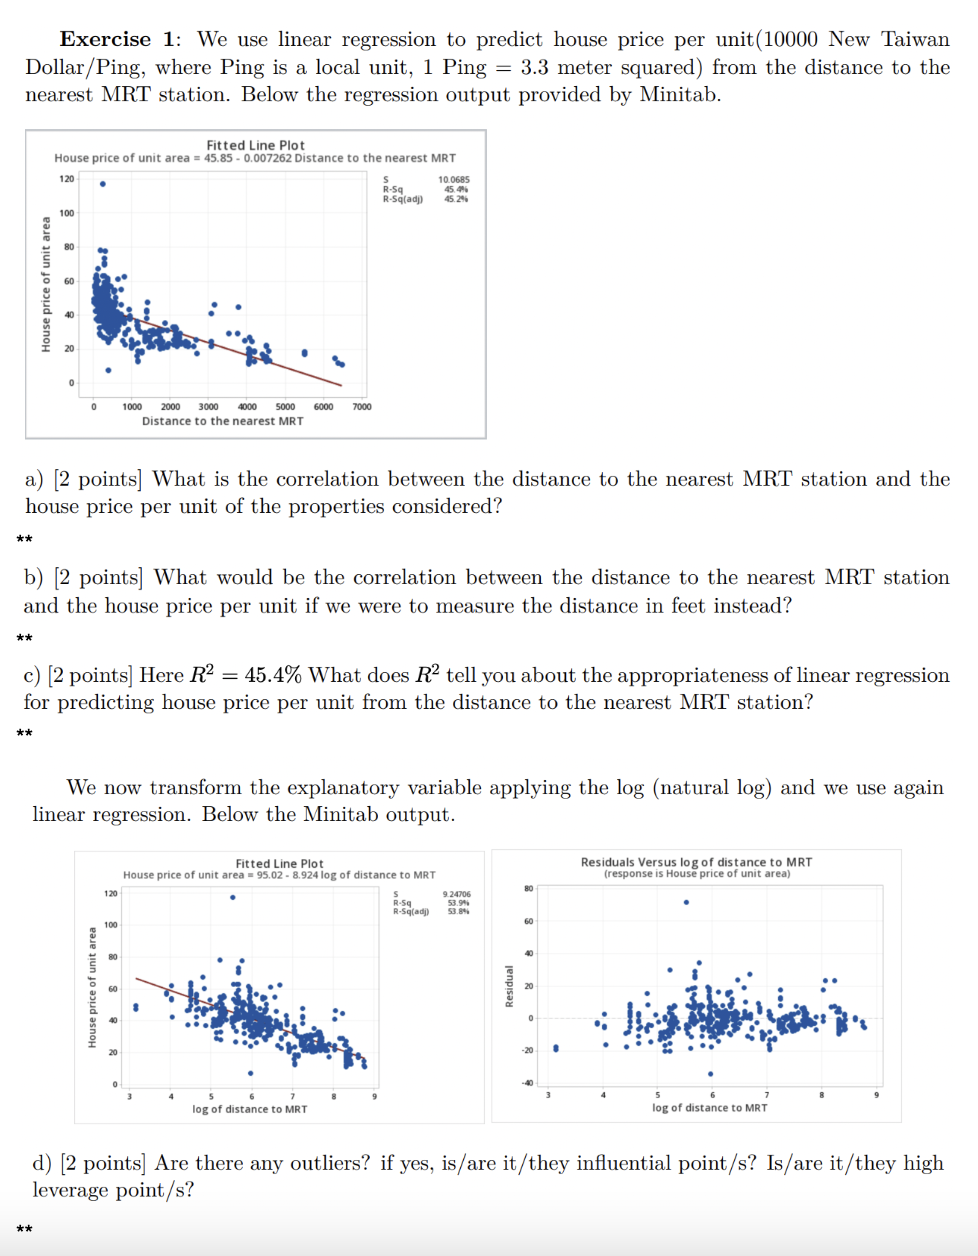
Exercise 1: We use linear regression to predict house price per unit (10000 New Taiwan Dollar/Ping, where Ping is a local unit, 1 Ping = 3.3 meter squared) from the distance to the nearest MRT station. Below the regression output provided by Minitab. Fitted Line Plot House price of unit area = 45.85 - 0.007262 Distance to the nearest MRT 120 45. 405 R-5q(adj) 45.20% 100 60 House price of unit area 1000 3000 4000 5000 6000 7000 Distance to the nearest MRT a) [2 points] What is the correlation between the distance to the nearest MRT station and the house price per unit of the properties considered? * * b) [2 points] What would be the correlation between the distance to the nearest MRT station and the house price per unit if we were to measure the distance in feet instead? * * c) [2 points] Here R2 = 45.4% What does R2 tell you about the appropriateness of linear regression for predicting house price per unit from the distance to the nearest MRT station? * * We now transform the explanatory variable applying the log (natural log) and we use again linear regression. Below the Minitab output. Fitted Line Plot Residuals Versus log of distance to MRT House price of unit area = 95.02 - 8.924 log of distance to MRT (response is House price of unit area) 120 R-Sq 9.24706 80 100 60 40 60 Residua House price of unit area 20 -20 log of distance to MRT log of distance to MRT d) [2 points] Are there any outliers? if yes, is/are it/they influential point/s? Is/are it/they high leverage point/s? * *
Step by Step Solution
There are 3 Steps involved in it

Get step-by-step solutions from verified subject matter experts