

Question: Exercise 13-4 Operating data for Grouper Corp. are presented below 2019 2018 Sales revenue Cost of goods sold Selling expenses Administrative expenses Income tax expense
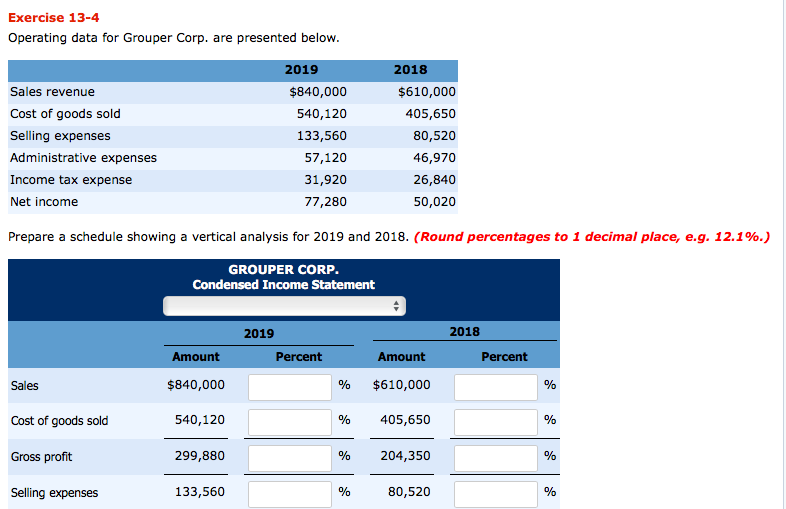
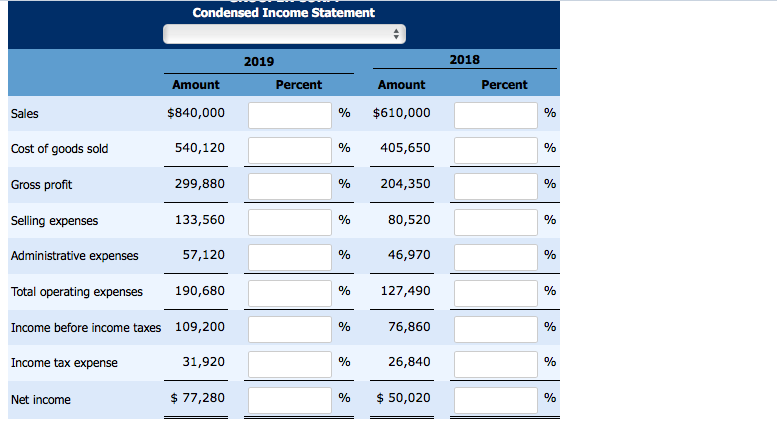
Exercise 13-4 Operating data for Grouper Corp. are presented below 2019 2018 Sales revenue Cost of goods sold Selling expenses Administrative expenses Income tax expense Net income $840,000 540,120 133,560 57,120 31,920 77,280 $610,000 405,650 80,520 46,970 26,840 50,020 Prepare a schedule showing a vertical analysis for 2019 and 2018. (Round percentages to 1 decimal place, eg. 12.1%.) GROUPER CORP. 2019 2018 Amount $840,000 540,120 299,880 133,560 Percent Amount Percent Sales Cost of goods sold Gross proft Selling expenses % $610,000 % 405,650 % 204,350 80,520 2019 2018 Amount $840,000 540,120 299,880 133,560 57,120 190,680 Income before income taxes 109,200 31,920 $ 77,280 Percent Amount Percent Sales Cost of goods sold Gross proft Selling expenses Administrative expenses Total operating expenses % $610,000 % 405,650 % 204,350 80,520 46,970 % 127,490 76,860 26,840 % $50,020 Income tax expense Net income
Step by Step Solution
There are 3 Steps involved in it

Get step-by-step solutions from verified subject matter experts