

Question: Exercise 2 - 2 Plot the surface of a function f ( x , y ) = 2 x 2 - 3 x - 3
Exercise
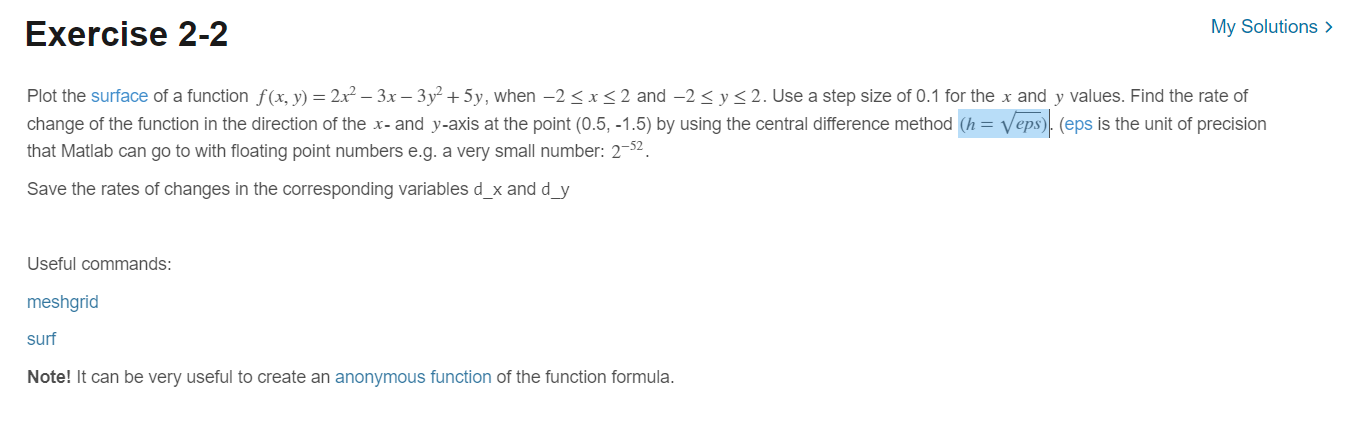
Plot the surface of a function when and Use a step size of for the and values. Find the rate of
change of the function in the direction of the and axis at the point by using the central difference method eps is the unit of precision
that Matlab can go to with floating point numbers eg a very small number:
Save the rates of changes in the corresponding variables and
Useful commands:
meshgrid
surf
Note! It can be very useful to create an anonymous function of the function formula.
Step by Step Solution
There are 3 Steps involved in it
1 Expert Approved Answer
Step: 1 Unlock

Question Has Been Solved by an Expert!
Get step-by-step solutions from verified subject matter experts
Step: 2 Unlock
Step: 3 Unlock