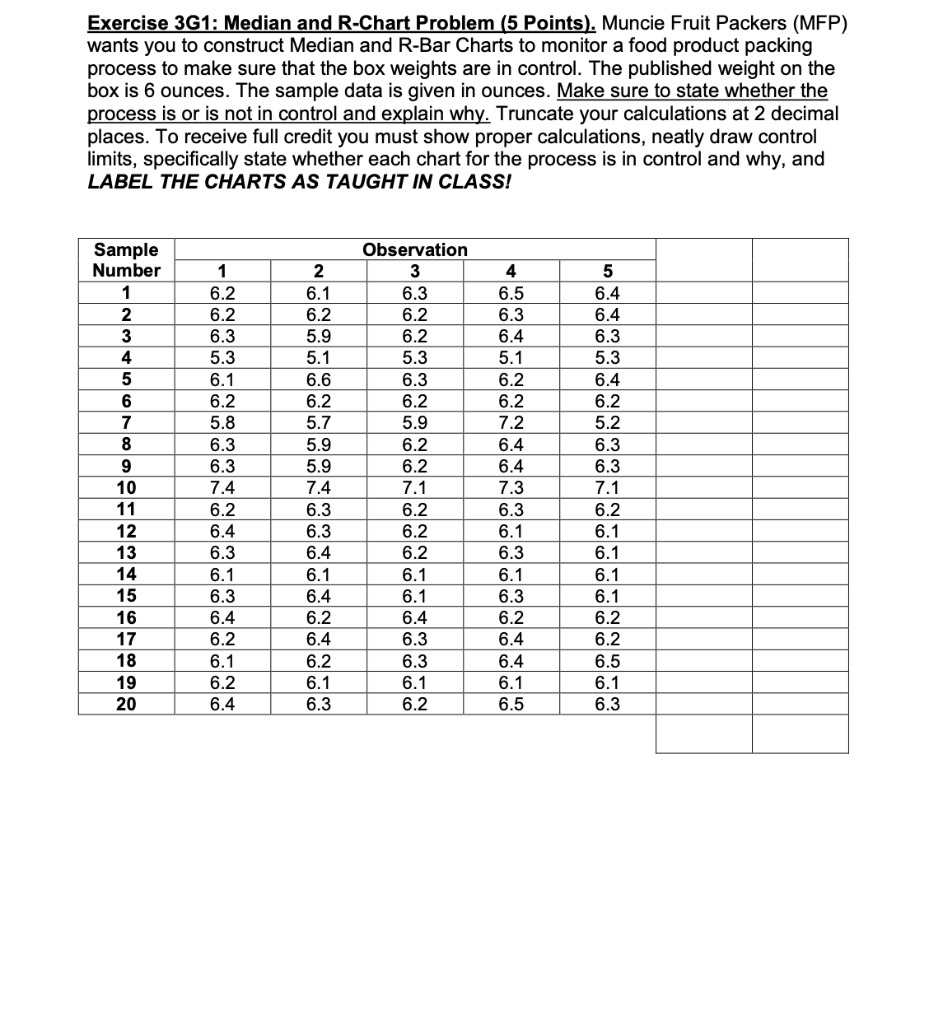
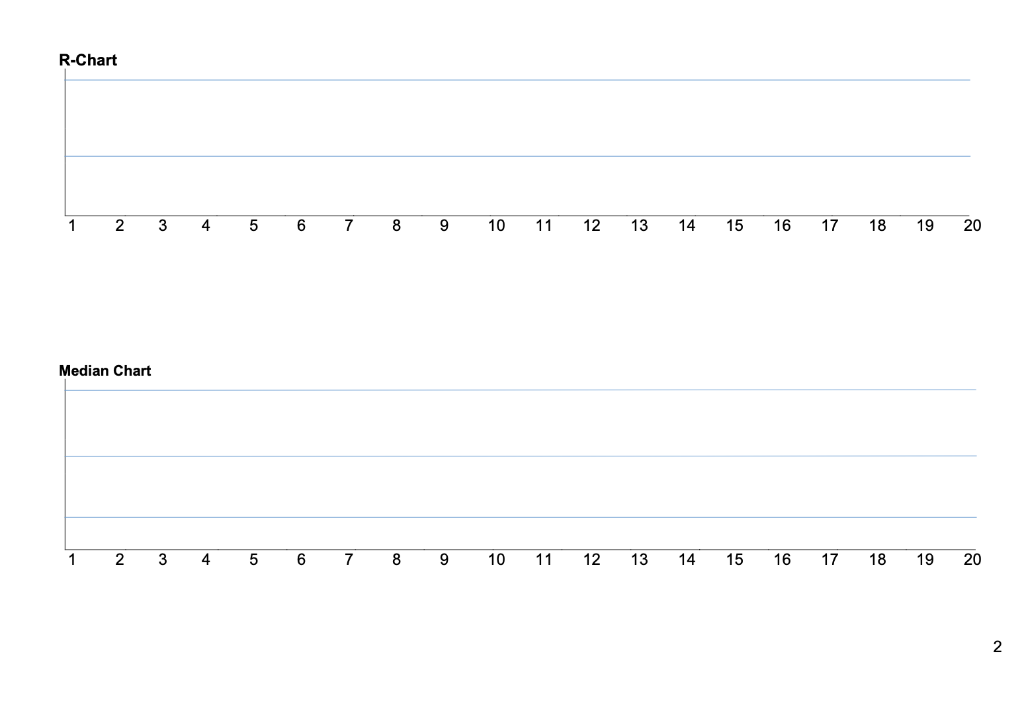
Question: Exercise 3G1: Median and R-Chart Problem (5 Points). Muncie Fruit Packers (MFP) wants you to construct Median and R-Bar Charts to monitor a food product

Exercise 3G1: Median and R-Chart Problem (5Exercise 3G1: Median and R-Chart Problem (5

Exercise 3G1: Median and R-Chart Problem (5 Points). Muncie Fruit Packers (MFP) wants you to construct Median and R-Bar Charts to monitor a food product packing process to make sure that the box weights are in control. The published weight on the box is 6 ounces. The sample data is given in ounces. Make sure to state whether the process is or is not in control and explain why. Truncate your calculations at 2 decimal places. To receive full credit you must show proper calculations, neatly draw control limits, specifically state whether each chart for the process is in control and why, and LABEL THE CHARTS AS TAUGHT IN CLASS! 4 6.5 6.3 6.4 Sample Number 1 2 3 4 5 6 7 8 9 10 11 12 13 14 15 16 17 18 19 20 1 6.2 6.2 6.3 5.3 6.1 6.2 5.8 6.3 6.3 7.4 6.2 6.4 6.3 6.1 6.3 6.4 6.2 6.1 6.2 6.4 2 6.1 6.2 5.9 5.1 6.6 6.2 5.7 5.9 5.9 7.4 6.3 6.3 6.4 6.1 6.4 6.2 6.4 6.2 6.1 6.3 Observation 3 6.3 6.2 6.2 5.3 6.3 6.2 5.9 6.2 6.2 7.1 6.2 6.2 6.2 6.1 6.1 6.4 6.3 6.3 6.1 6.2 6.2 6.2 7.2 6.4 6.4 7.3 6.3 6.1 6.3 6.1 6.3 6.2 6.4 6.4 6.1 6.5 5 6.4 6.4 6.3 5.3 6.4 6.2 5.2 6.3 6.3 7.1 6.2 6.1 6.1 6.1 6.1 6.2 6.2 6.5 6.1 6.3 R-Chart 1 2 3 4 5 6 7 8 9 10 11 12 13 14 15 16 17 18 19 20 Median Chart 1. 2 3 4 5 6 7 8 9 10 11 12 13 14 15 16 17 18 19 20 2

Step by Step Solution

There are 3 Steps involved in it

1 Expert Approved Answer
Step: 1 Unlock blur-text-image
Question Has Been Solved by an Expert!

Get step-by-step solutions from verified subject matter experts

Step: 2 Unlock
Step: 3 Unlock

Students Have Also Explored These Related General Management Questions!