

Question: Exercise 5 2008. Classification using Bayes rule Remember that, when assuming a 2D Gaussian distribution, the point probability of a point x=[x1, x2]' can be
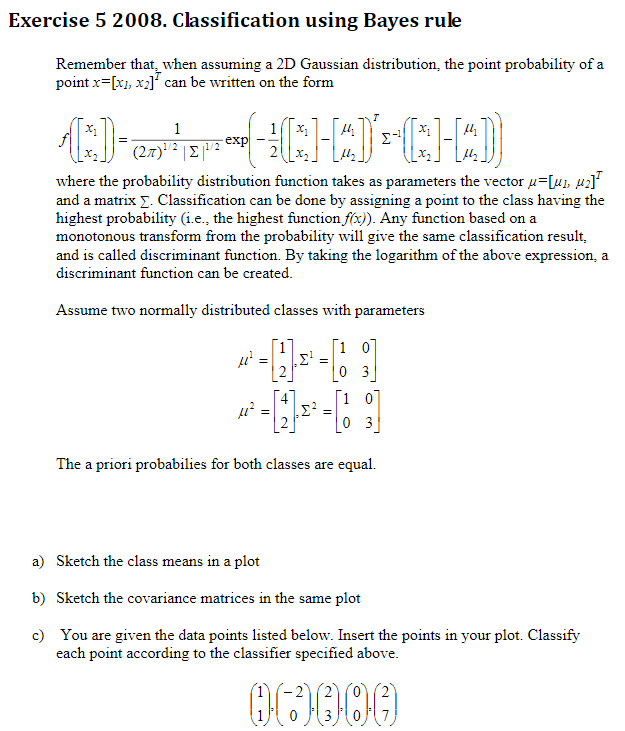
Exercise 5 2008. Classification using Bayes rule Remember that, when assuming a 2D Gaussian distribution, the point probability of a point x=[x1, x2]' can be written on the form 1 X: 1 x ( (%)=0) 1 . ul exp (2) 2 1 2 where the probability distribution function takes as parameters the vector u=[ui, uz] and a matrix I. Classification can be done by assigning a point to the class having the highest probability (i.e., the highest function f(x)). Any function based on a monotonous transform from the probability will give the same classification result, and is called discriminant function. By taking the logarithm of the above expression, a discriminant function can be created. Assume two normally distributed classes with parameters u u ' = i 0] 03 [1 0 03 u The a priori probabilies for both classes are equal. a) Sketch the class means in a plot b) Sketch the covariance matrices in the same plot c) You are given the data points listed below. Insert the points in your plot. Classify each point according to the classifier specified above. 001000 Exercise 5 2008. Classification using Bayes rule Remember that, when assuming a 2D Gaussian distribution, the point probability of a point x=[x1, x2]' can be written on the form 1 X: 1 x ( (%)=0) 1 . ul exp (2) 2 1 2 where the probability distribution function takes as parameters the vector u=[ui, uz] and a matrix I. Classification can be done by assigning a point to the class having the highest probability (i.e., the highest function f(x)). Any function based on a monotonous transform from the probability will give the same classification result, and is called discriminant function. By taking the logarithm of the above expression, a discriminant function can be created. Assume two normally distributed classes with parameters u u ' = i 0] 03 [1 0 03 u The a priori probabilies for both classes are equal. a) Sketch the class means in a plot b) Sketch the covariance matrices in the same plot c) You are given the data points listed below. Insert the points in your plot. Classify each point according to the classifier specified above. 001000
Step by Step Solution
There are 3 Steps involved in it

Get step-by-step solutions from verified subject matter experts