

Question: Exercise 5 (Use R) (1 pt) Using the 5 data points from the previous exercise, use R to plot the likelihood function as a
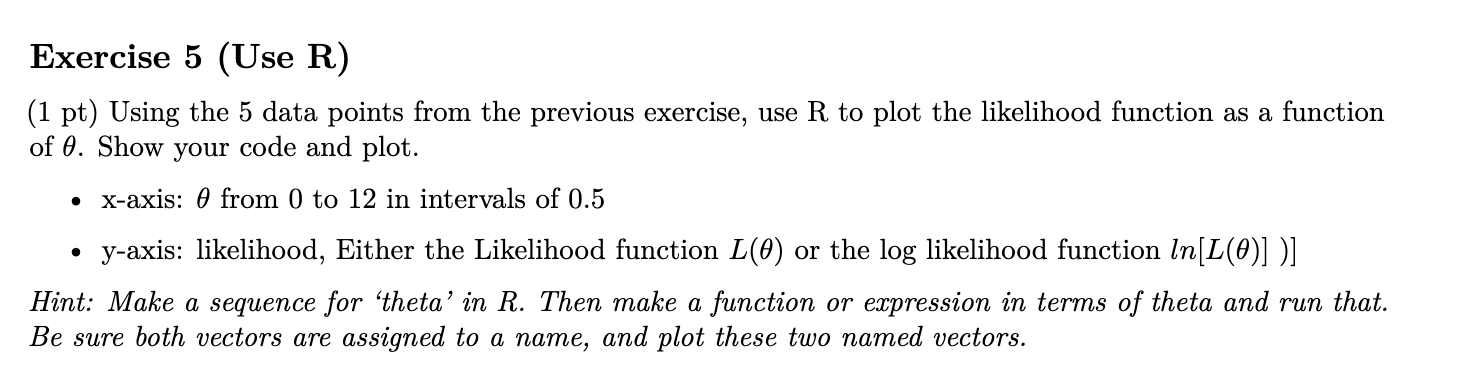
Exercise 5 (Use R) (1 pt) Using the 5 data points from the previous exercise, use R to plot the likelihood function as a function of 0. Show your code and plot. x-axis: 0 from 0 to 12 in intervals of 0.5 y-axis: likelihood, Either the Likelihood function L(0) or the log likelihood function In[L(0)])] Hint: Make a sequence for 'theta' in R. Then make a function or expression in terms of theta and run that. Be sure both vectors are assigned to a name, and plot these two named vectors.
Step by Step Solution
There are 3 Steps involved in it
1 Expert Approved Answer
Step: 1 Unlock

Question Has Been Solved by an Expert!
Get step-by-step solutions from verified subject matter experts
Step: 2 Unlock
Step: 3 Unlock