

Question: Exhibit 1 - Income Statement ($ in millions except for price per share) ncome Statement Net Sales 06/30/07 06/30/08 06/30/09 06/30/10 06/30/11 06/30/12 06/30/13
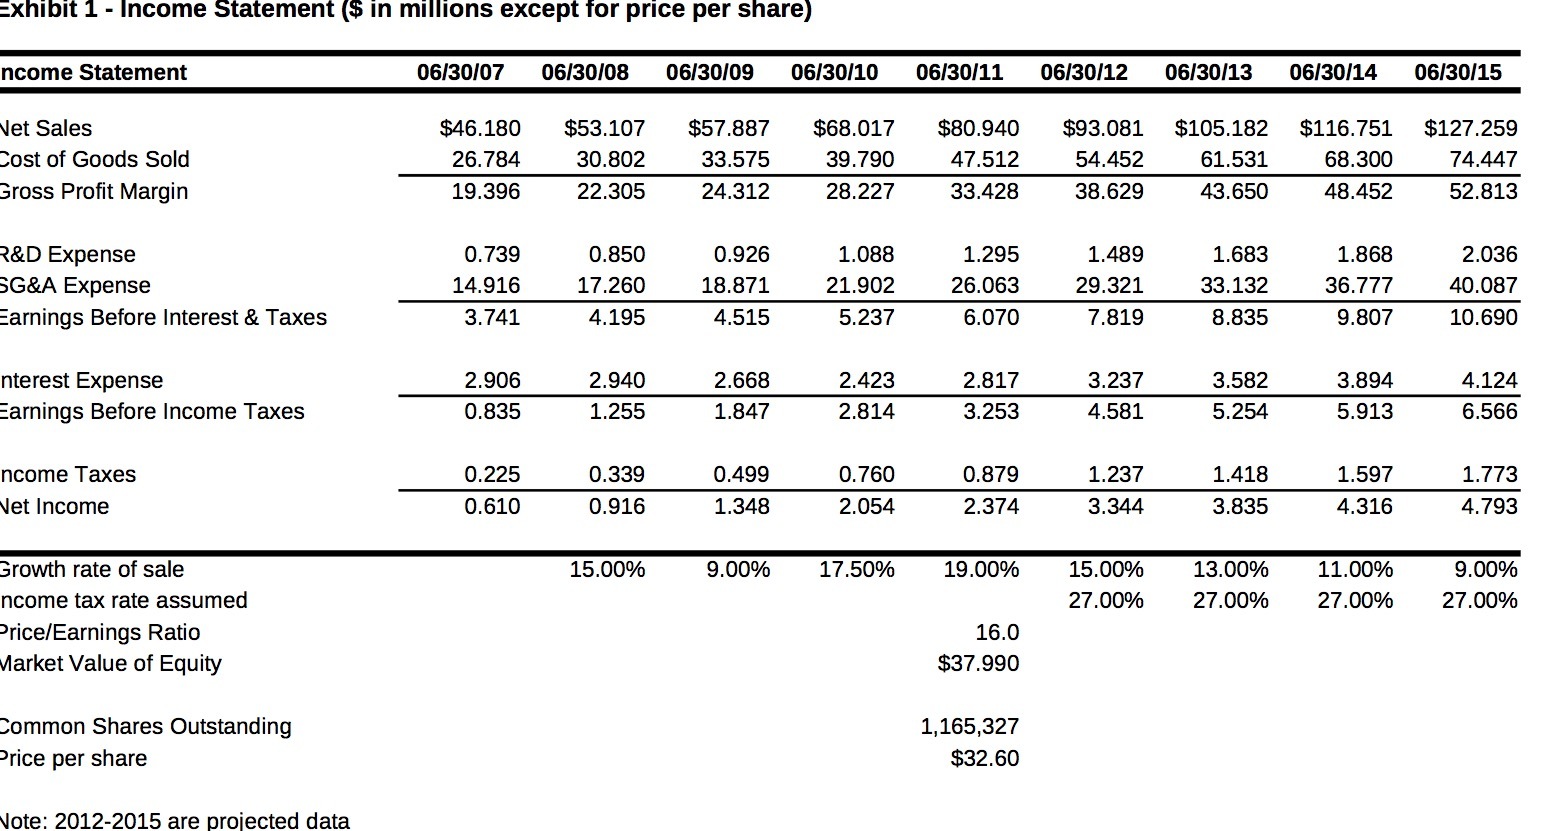

Exhibit 1 - Income Statement ($ in millions except for price per share) ncome Statement Net Sales 06/30/07 06/30/08 06/30/09 06/30/10 06/30/11 06/30/12 06/30/13 06/30/14 06/30/15 Cost of Goods Sold Gross Profit Margin 26.784 19.396 $46.180 $53.107 30.802 22.305 28.227 $57.887 $68.017 $80.940 $93.081 $105.182 33.575 39.790 54.452 24.312 $116.751 $127.259 47.512 61.531 68.300 74.447 33.428 38.629 43.650 48.452 52.813 R&D Expense 0.739 0.850 0.926 1.088 1.295 1.489 1.683 1.868 2.036 SG&A Expense 14.916 17.260 18.871 21.902 26.063 29.321 33.132 36.777 40.087 Earings Before Interest & Taxes 3.741 4.195 4.515 5.237 6.070 7.819 8.835 9.807 10.690 nterest Expense 2.906 2.940 2.668 2.423 2.817 3.237 3.582 3.894 4.124 Earnings Before Income Taxes 0.835 1.255 1.847 2.814 3.253 4.581 5.254 5.913 6.566 ncome Taxes 0.225 0.339 0.499 0.760 0.879 1.237 1.418 1.597 1.773 Net Income 0.610 0.916 1.348 2.054 2.374 3.344 3.835 4.316 4.793 Growth rate of sale 15.00% 9.00% 17.50% 19.00% 15.00% 13.00% 11.00% 9.00% Price/Earnings Ratio ncome tax rate assumed Market Value of Equity 27.00% 27.00% 27.00% 27.00% 16.0 $37.990 Common Shares Outstanding Price per share Note: 2012-2015 are projected data 1,165,327 $32.60
Step by Step Solution
There are 3 Steps involved in it

Get step-by-step solutions from verified subject matter experts