Question: EXHIBIT 1 Selected Financial Data for Under Armour, Inc.. 20162019 (in millions} Selected Income Statement Data Net revenues Cost or goods sold Gross prot Selling,
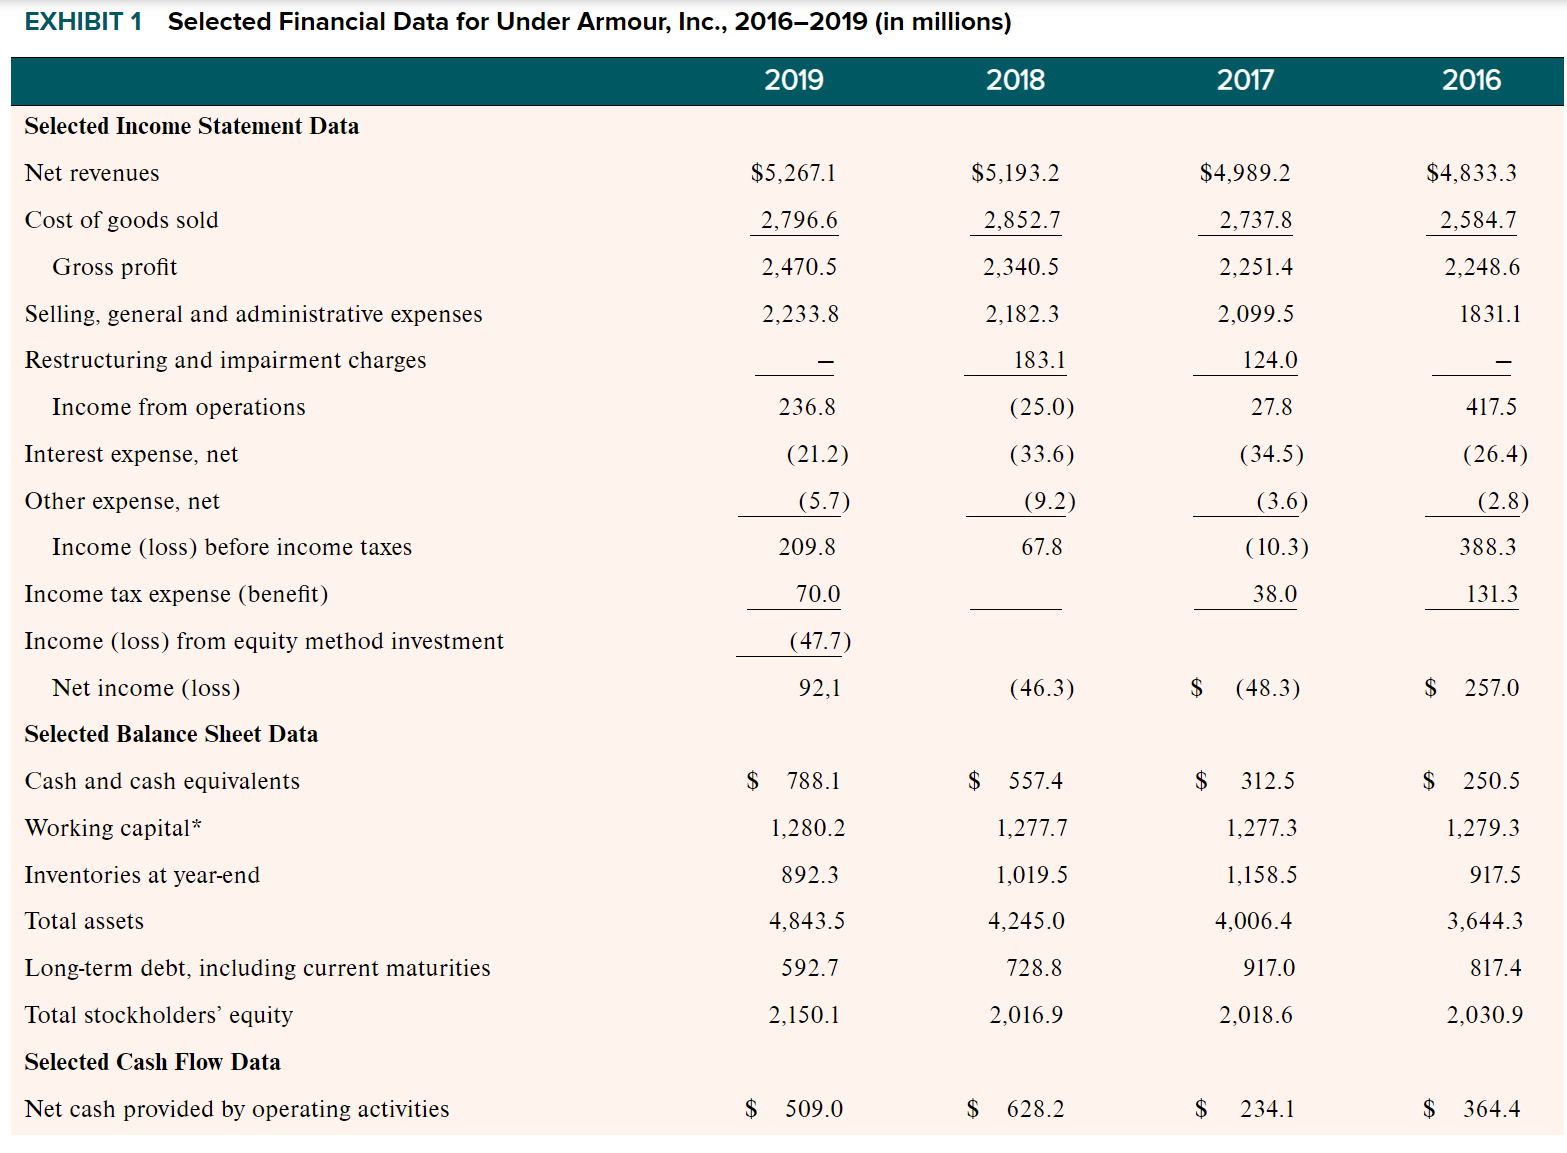
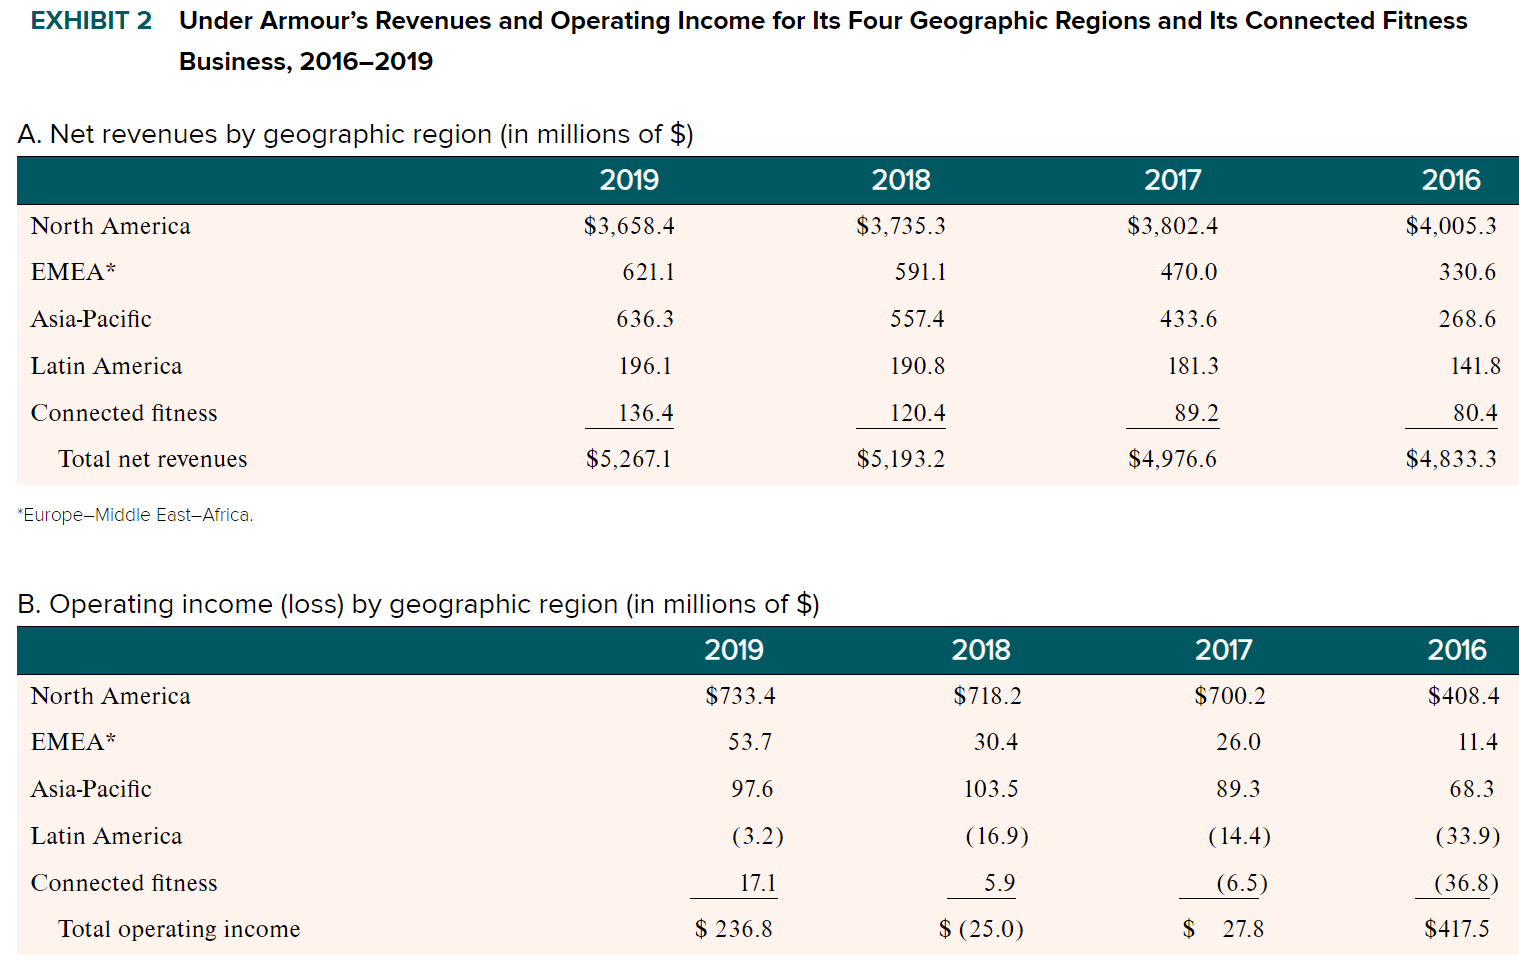
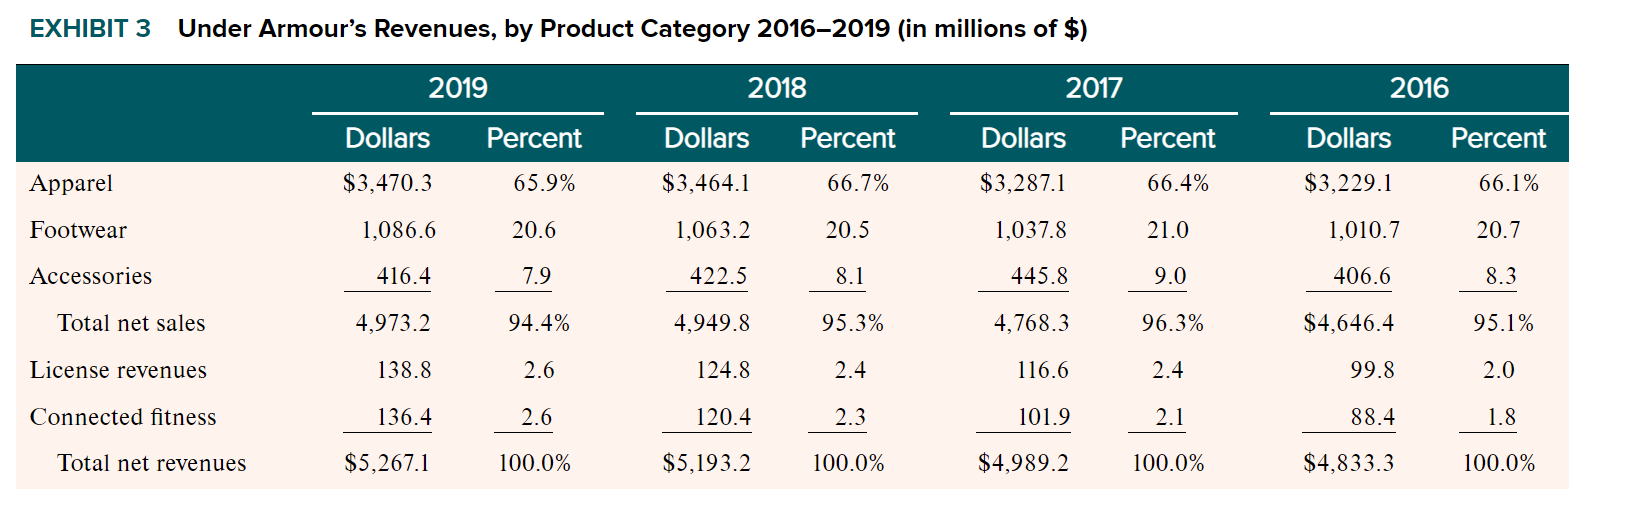
EXHIBIT 1 Selected Financial Data for Under Armour, Inc.. 20162019 (in millions} Selected Income Statement Data Net revenues Cost or\" goods sold Gross prot Selling, general and administrative expenses Restructuring and impairment charges Income from operations Interest expense, net Other expense. net Income (loss) before income taxes Income tax expense (benet) Income (loss) from equity method investment Net income (loss) Selected Balance Sheet Data Cash and cash equivalents Working capita1* Inventories at year-end Total assets Long-term debt, including current maturities Total stockholders\" equity Selected Cash Flow Data Net cash provided by operating activities 2019 $5,267.] 2796.6 2,470.5 2,233.8 236.8 (21.2) (5-7) 209.8 70.0 (47.7) 92,1 2018 $5,193.2 2852.7 2,340.5 2,182.3 183.1 (25.0) (33.6) (9.2) 67.8 (46.3) $ 557.4 1,277.7 1,019.5 4,245.0 728.8 2,016.9 $ 628.2 2017 $49892 2,737.8 2,251.4 2,099.5 124.0 27.8 (34.5) (3-6) (10.3) 33.0 $ (48.3) $ 312.5 1,277.3 1,158.5 4,006.4 917.0 2,018.6 $ 234.1 2016 $48333 2,584.7 2,248.6 1831.1 417.5 (26.4) (2-3) 388.3 131.3 EXHIBIT 2 Under Armour's Revenues and Operating Income for Its Four Geographic Regions and Its Connected Fitness Business, 2016-2019 A. Net revenues by geographic region (in millions of $) 2019 2018 2017 2016 North America $3,658.4 $3,735.3 $3,802.4 $4,005.3 EMEA* 621.1 591.1 470.0 330.6 Asia-Pacific 636.3 557.4 433.6 268.6 Latin America 196.1 190.8 181.3 141.8 Connected fitness 136.4 120.4 89.2 80.4 Total net revenues $5,267.1 $5,193.2 $4,976.6 $4,833.3 *Europe-Middle East-Africa. B. Operating income (loss) by geographic region (in millions of $) 2019 2018 2017 2016 North America $733.4 $718.2 $700.2 $408.4 EMEA* 53.7 30.4 26.0 11.4 Asia-Pacific 97.6 103.5 89.3 68.3 Latin America (3.2) (16.9) (14.4) (33.9) Connected fitness 17.1 5.9 (6.5) (36.8) Total operating income $ 236.8 $ (25.0) $ 27.8 $417.5EXHIBIT 3 Under Armour's Revenues, by Product Category 2016-2019 (in millions of $) 2019 2018 2017 2016 Dollars Percent Dollars Percent Dollars Percent Dollars Percent Apparel $3,470.3 65.9% $3,464.1 66.7% $3,287.1 66.4% $3,229.1 66.1% Footwear 1,086.6 20.6 1,063.2 20.5 1,037.8 21.0 1,010.7 20.7 Accessories 416.4 7.9 422.5 8.1 445.8 9.0 406.6 8.3 Total net sales 4,973.2 94.4% 4,949.8 95.3% 4,768.3 96.3% $4,646.4 95.1% License revenues 138.8 2.6 124.8 2.4 116.6 2.4 99.8 2.0 Connected fitness 136.4 2.6 120.4 2.3 101.9 2. 1 88.4 1.8 Total net revenues $5,267.1 100.0% $5,193.2 100.0% $4,989.2 100.0% $4,833.3 100.0%
Step by Step Solution
There are 3 Steps involved in it
1 Expert Approved Answer
Step: 1 Unlock
Question Has Been Solved by an Expert!
Get step-by-step solutions from verified subject matter experts
Step: 2 Unlock
Step: 3 Unlock
Students Have Also Explored These Related Finance Questions!