

Question: Exhibit 10 Airbus Development Expenditure by Year ($ millions) Key Assumptions as of 2008 in milions Price per Plane$225 millions Number of Planes 44 Operating
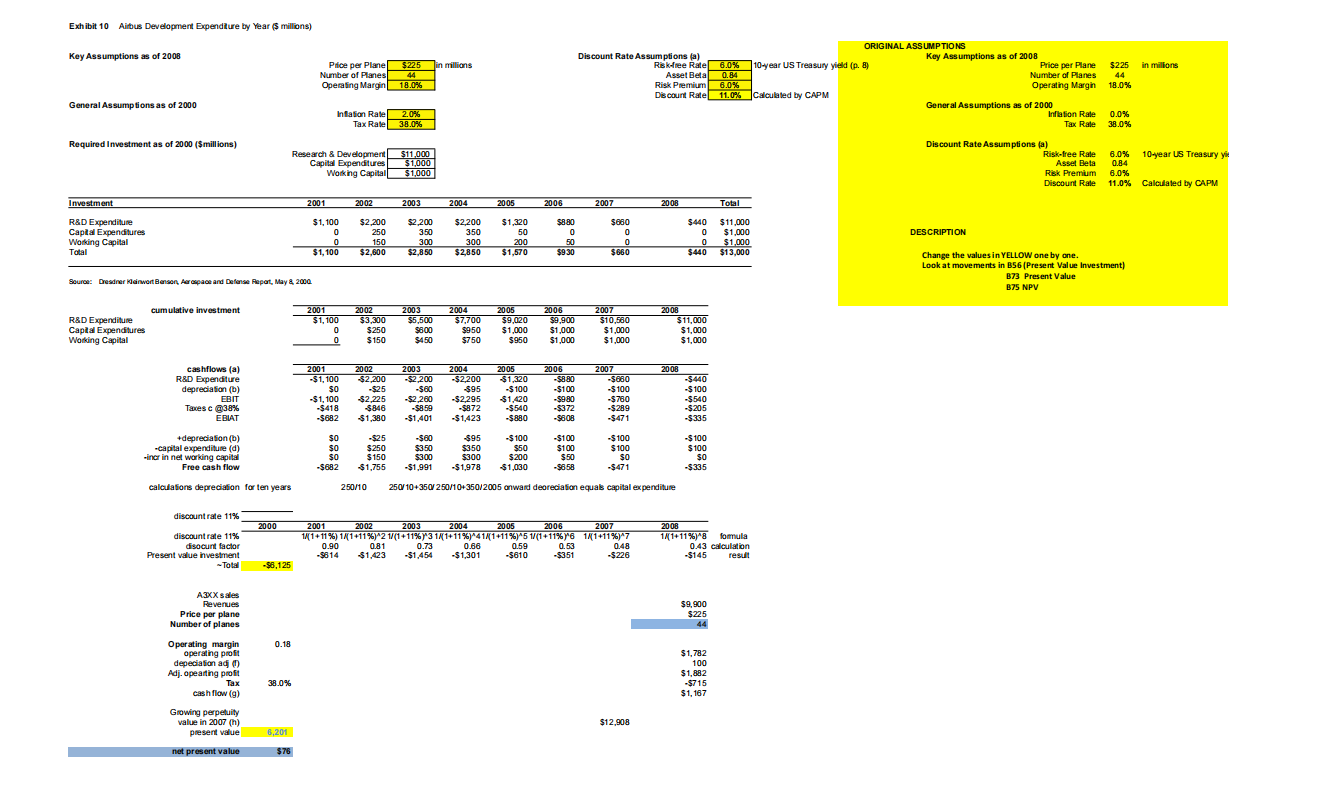
Exhibit 10 Airbus Development Expenditure by Year ($ millions) Key Assumptions as of 2008 in milions Price per Plane$225 millions Number of Planes 44 Operating Margin 18.0% ORIGINAL ASSUMPTIONS Discount Rate Assumptions (a) Key Assumptions as of 2008 Rate 6.0% 10-year US Treasury yield (p. 8) p. Price per Plane $225 Asset Beta 0.84 Number of Planes 44 Risk Premium 6.0% Operating Margin 18.0% Discount Rate 11.0% Calculated by CAPM General Assumptions as of 2000 Inflation Rate 0.0% Tax Rate 38.0% General Assumptions as of 2000 Inflation Rate 2.0% Tax Rate 38.0% Required Investment as of 2000 ($millions) Research & Development $11,000 Capital Expenditures $1,000 Working Capital $1,000 Discount Rate Assumptions (a) Risk-free Rate Asset Beta Risk Premium Discount Rate 6.0% 10-year US Treasury yer 0.84 6.0% 11.0% Calculated by CAPM Investment 2001 2002 2003 2004 2005 2006 2007 2008 Total R&D Expenditure Capital Expenditures Working Capital Total $1,100 0 0 $1,100 $2,200 250 150 $2,600 $2,200 350 300 $2,850 $2,200 350 300 $2,850 $1,320 50 200 $1,570 $880 0 50 $930 $680 0 o 0 $660 $440 0 0 $440 DESCRIPTION $11,000 $1,000 $1.000 $13,000 Change the values in YELLOW one by one. Look at movements in B56 (Present Value Investment) B73 Present Value B7S NPV Source: Dresdner Klawert Benson, Aerospace and Defense Repat, May & 2000 cumulative investment 2008 2001 $1,100 0 0 R&D Expenditure Capital Expenditures Working Capital 2002 $3,300 $250 $150 2003 $5,500 $600 $450 2004 $7,700 $950 $750 2005 $9,020 $1,000 $950 2006 $9.900 $1,000 $1,000 2007 $ $1,000 $1,000 $11,000 $1,000 $1,000 2008 cashflows (a) R&D Expenditure depreciation (1) EBIT Taxes c 38% EBIAT 2001 -$1,100 $0 $1,100 -$418 $682 2002 $2,200 -$25 $2.225 $846 $1,380 2003 -$2,200 -$60 -$2,260 -$859 -$1,401 2004 -$2,200 $95 -$2,295 -$872 -$1,423 2005 $1,320 -$100 $1,420 -$540 $880 2006 -$8.80 -$100 -$980 -$372 -$808 2007 $680 -$100 -$760 -$289 -$471 -$440 $100 -$540 -$205 -$335 +depreciation (b) -capital expenditure (0) incr in net working capital Free cash flow $0 $0 $0 $682 -$25 $250 $150 $1,755 -$60 $350 $300 -$1.991 $95 $350 $300 $1,978 $100 $50 $200 $1.030 -$100 - $100 $50 -9858 -$100 $100 $0 $471 $100 $100 $0 -$335 calculations depreciation for ten years 250/10 250/ 10+350/250/10*350/2005 onward deoreciation equals capital expenditure 2000 discount rate 11% discount rate 11% discount factor Present value investment -Total 2001 2002 2003 2004 2005 2006 2007 1/(1+11 %) 1 (1+11 %)*2 1/(1+11%y3 1/1+11%)*41/(1+11%)*5 1/(1+11%Y6 11+11%)*7 0.90 0.81 0.73 0.66 0.59 0.53 0.48 -9814 $1,423 -$1.454 -$1,301 -S610 -$351 -$226 2008 1/(1+11%/8 fomula 0.43 calculation -$145 resul! $6,125 A3XX sales Revenues Price per plane Number of planes $9.900 $225 0.18 Operating margin operating profit depeciation ado Adj.opeasting profit Tax cash flow (a) $1,782 100 $1,882 $715 $1,167 38.09 $12.908 Growing perpetuity value in 2007 (1) present value 6,201 net present value $76 2. The Airbus case makes specific assumptions about a number of parameters. For your convenience, a table is reproduced in the appendix. 2.a Fully explain possible causes and overall effects of an increase in the asset beta. Would it be the same of an increase in the cost of capital? [15 marks] 2.b State your views with respect to the Airbus case assumption of an asset beta of 0.84. Discuss the arguments that consider it too low and those that consider it too high. [10 marks] Exhibit 10 Airbus Development Expenditure by Year ($ millions) Key Assumptions as of 2008 in milions Price per Plane$225 millions Number of Planes 44 Operating Margin 18.0% ORIGINAL ASSUMPTIONS Discount Rate Assumptions (a) Key Assumptions as of 2008 Rate 6.0% 10-year US Treasury yield (p. 8) p. Price per Plane $225 Asset Beta 0.84 Number of Planes 44 Risk Premium 6.0% Operating Margin 18.0% Discount Rate 11.0% Calculated by CAPM General Assumptions as of 2000 Inflation Rate 0.0% Tax Rate 38.0% General Assumptions as of 2000 Inflation Rate 2.0% Tax Rate 38.0% Required Investment as of 2000 ($millions) Research & Development $11,000 Capital Expenditures $1,000 Working Capital $1,000 Discount Rate Assumptions (a) Risk-free Rate Asset Beta Risk Premium Discount Rate 6.0% 10-year US Treasury yer 0.84 6.0% 11.0% Calculated by CAPM Investment 2001 2002 2003 2004 2005 2006 2007 2008 Total R&D Expenditure Capital Expenditures Working Capital Total $1,100 0 0 $1,100 $2,200 250 150 $2,600 $2,200 350 300 $2,850 $2,200 350 300 $2,850 $1,320 50 200 $1,570 $880 0 50 $930 $680 0 o 0 $660 $440 0 0 $440 DESCRIPTION $11,000 $1,000 $1.000 $13,000 Change the values in YELLOW one by one. Look at movements in B56 (Present Value Investment) B73 Present Value B7S NPV Source: Dresdner Klawert Benson, Aerospace and Defense Repat, May & 2000 cumulative investment 2008 2001 $1,100 0 0 R&D Expenditure Capital Expenditures Working Capital 2002 $3,300 $250 $150 2003 $5,500 $600 $450 2004 $7,700 $950 $750 2005 $9,020 $1,000 $950 2006 $9.900 $1,000 $1,000 2007 $ $1,000 $1,000 $11,000 $1,000 $1,000 2008 cashflows (a) R&D Expenditure depreciation (1) EBIT Taxes c 38% EBIAT 2001 -$1,100 $0 $1,100 -$418 $682 2002 $2,200 -$25 $2.225 $846 $1,380 2003 -$2,200 -$60 -$2,260 -$859 -$1,401 2004 -$2,200 $95 -$2,295 -$872 -$1,423 2005 $1,320 -$100 $1,420 -$540 $880 2006 -$8.80 -$100 -$980 -$372 -$808 2007 $680 -$100 -$760 -$289 -$471 -$440 $100 -$540 -$205 -$335 +depreciation (b) -capital expenditure (0) incr in net working capital Free cash flow $0 $0 $0 $682 -$25 $250 $150 $1,755 -$60 $350 $300 -$1.991 $95 $350 $300 $1,978 $100 $50 $200 $1.030 -$100 - $100 $50 -9858 -$100 $100 $0 $471 $100 $100 $0 -$335 calculations depreciation for ten years 250/10 250/ 10+350/250/10*350/2005 onward deoreciation equals capital expenditure 2000 discount rate 11% discount rate 11% discount factor Present value investment -Total 2001 2002 2003 2004 2005 2006 2007 1/(1+11 %) 1 (1+11 %)*2 1/(1+11%y3 1/1+11%)*41/(1+11%)*5 1/(1+11%Y6 11+11%)*7 0.90 0.81 0.73 0.66 0.59 0.53 0.48 -9814 $1,423 -$1.454 -$1,301 -S610 -$351 -$226 2008 1/(1+11%/8 fomula 0.43 calculation -$145 resul! $6,125 A3XX sales Revenues Price per plane Number of planes $9.900 $225 0.18 Operating margin operating profit depeciation ado Adj.opeasting profit Tax cash flow (a) $1,782 100 $1,882 $715 $1,167 38.09 $12.908 Growing perpetuity value in 2007 (1) present value 6,201 net present value $76 2. The Airbus case makes specific assumptions about a number of parameters. For your convenience, a table is reproduced in the appendix. 2.a Fully explain possible causes and overall effects of an increase in the asset beta. Would it be the same of an increase in the cost of capital? [15 marks] 2.b State your views with respect to the Airbus case assumption of an asset beta of 0.84. Discuss the arguments that consider it too low and those that consider it too high. [10 marks]
Step by Step Solution
There are 3 Steps involved in it

Get step-by-step solutions from verified subject matter experts