

Question: Exhibit 10.13 - Factor for Determining 3-Sigma Limits for R-bar and x-bar Charts c. Determine the UCL and LCL for a X chart. (Round your
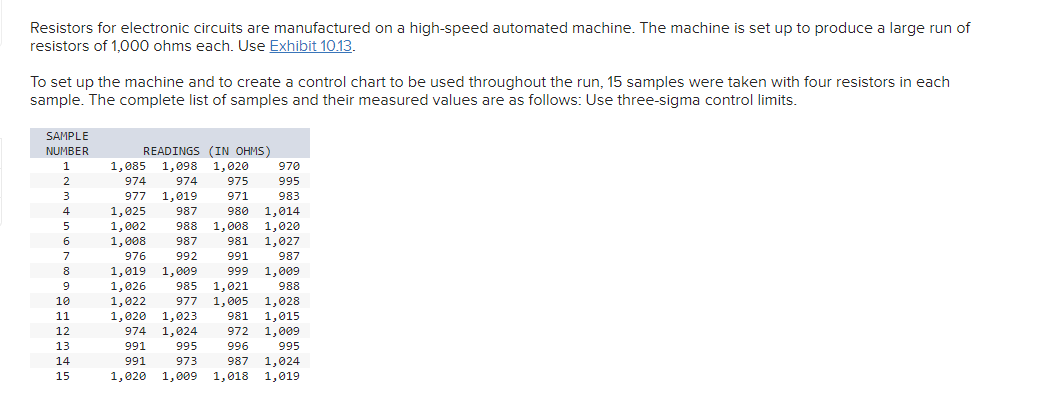
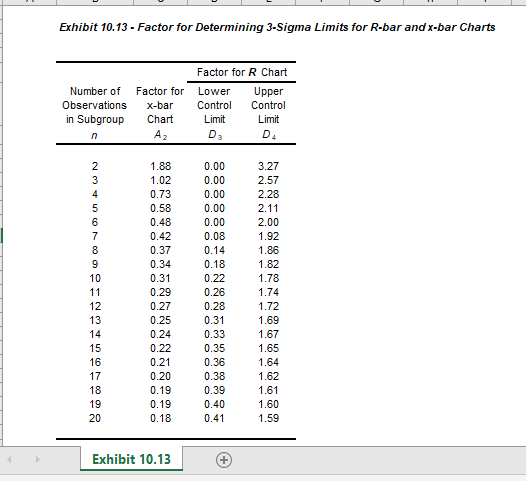
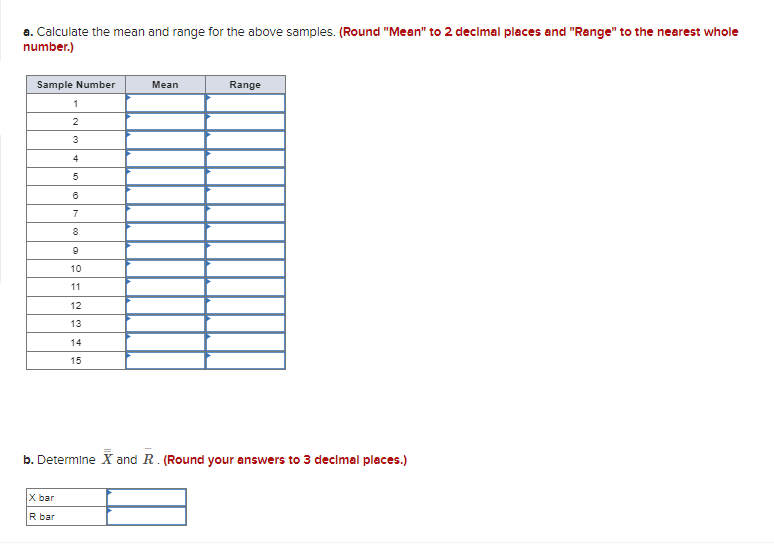
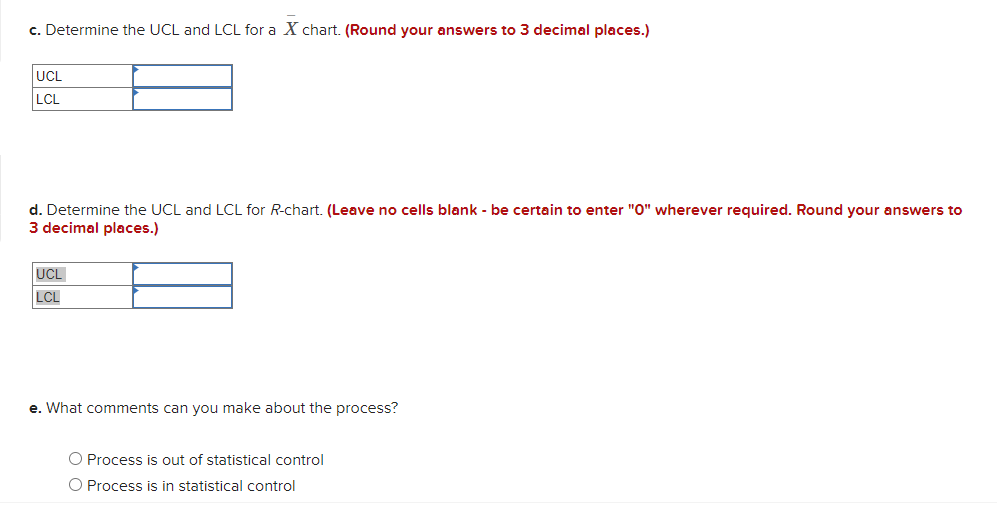
Exhibit 10.13 - Factor for Determining 3-Sigma Limits for R-bar and x-bar Charts c. Determine the UCL and LCL for a X chart. (Round your answers to 3 decimal places.) d. Determine the UCL and LCL for R-chart. (Leave no cells blank - be certain to enter " 0 " wherever required. Round your answers to 3 decimal places.) e. What comments can you make about the process? Process is out of statistical control Process is in statistical control a. Calculate the mean and range for the above samples. (Round "Mean" to 2 decimal places and "Range" to the nearest whole number.) b. DetermIne X and R. (Round your answers to 3 decimal places.) Resistors for electronic circuits are manufactured on a high-speed automated machine. The machine is set up to produce a large run of resistors of 1,000 ohms each. Use Exhibit 10.13. To set up the machine and to create a control chart to be used throughout the run, 15 samples were taken with four resistors in each sample. The complete list of samples and their measured values are as follows: Use three-sigma control limits
Step by Step Solution
There are 3 Steps involved in it

Get step-by-step solutions from verified subject matter experts