

Question: Exhibit 10.13 - Factor for Determining 3-Sigma Limits for R-bar and x-bar Charts a. Calculate the mean and range for the above samples. Note: Round
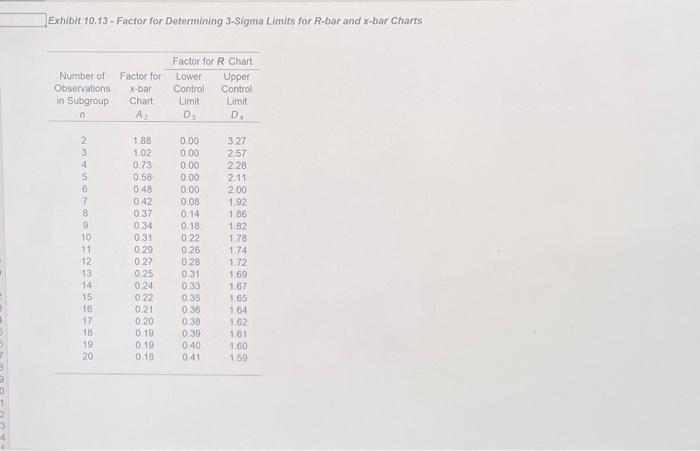
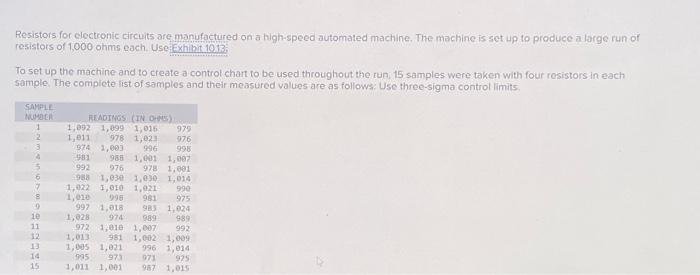
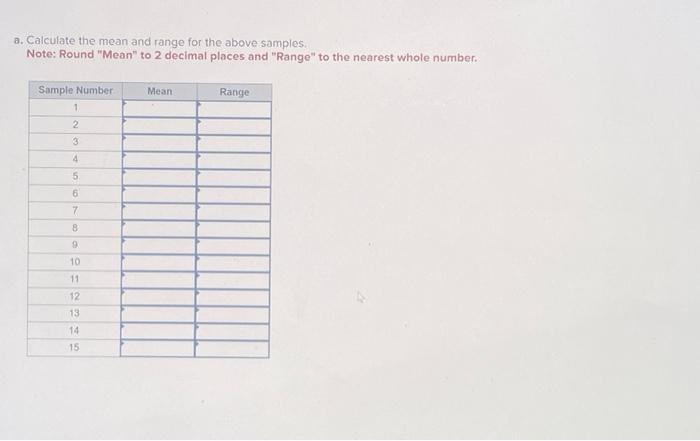
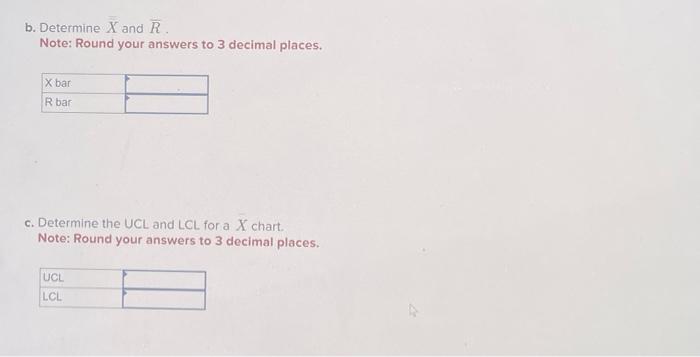
Exhibit 10.13 - Factor for Determining 3-Sigma Limits for R-bar and x-bar Charts a. Calculate the mean and range for the above samples. Note: Round "Mean" to 2 decimal places and "Range" to the nearest whole number. Resistors for clectronic circuits are manufactured on a high-speed automated machine. The machine is sct up to produce a large run of resistors of 1,000 ohms each. Use To set up the machine and to create a control chart to be used throughout the rue, 15 samples were taken with four resistors in each sample. The compicte list of samples and their measured values are as follows: Use three-sigma control limits. b. Determine X and R. Note: Round your answers to 3 decimal places. c. Determine the UCL and LCL for a X chart. Note: Round your answers to 3 decimal places. d. Determine the UCL and LCL for R-chart. Note: Leave no cells blank - be certain to enter " 0 " wherever required. Round your answers to 3 decimal places. e. What comments can you make about the process? Procese is out of statistical controt Process is in statistical control
Step by Step Solution
There are 3 Steps involved in it

Get step-by-step solutions from verified subject matter experts