

Question: Exhibit 1-1. A multiple linear regression was used to study how family spending ()) is influenced by income (x1), family size (x2), and additions to
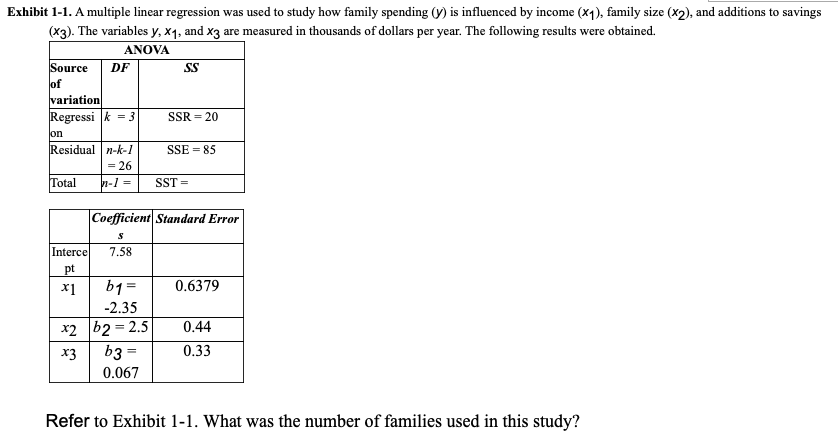

Exhibit 1-1. A multiple linear regression was used to study how family spending ()) is influenced by income (x1), family size (x2), and additions to savings (x3). The variables y, x1, and x3 are measured in thousands of dollars per year. The following results were obtained. ANOVA Source DF SS of variation Regressi k = 3 SSR = 20 on Residual n-k-1 SSE = 85 = 26 Total n-1 = SST = Coefficient Standard Error Interce 7.58 pt 0.6379 -2.35 *2 b2 = 2.5 0.44 X3 b3 0.33 0.067 Refer to Exhibit 1-1. What was the number of families used in this study?
Step by Step Solution
There are 3 Steps involved in it
1 Expert Approved Answer
Step: 1 Unlock

Question Has Been Solved by an Expert!
Get step-by-step solutions from verified subject matter experts
Step: 2 Unlock
Step: 3 Unlock