

Question: R 1 points Exhibit 1-1. A multiple linear regression was used to study how family spending (y) is influenced by income (x1), family size
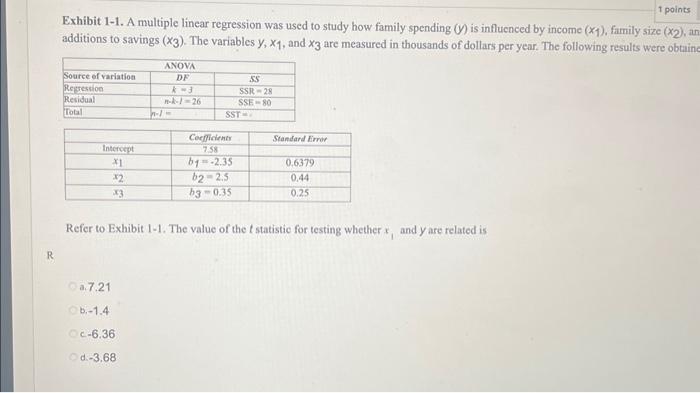
R 1 points Exhibit 1-1. A multiple linear regression was used to study how family spending (y) is influenced by income (x1), family size (x2), an additions to savings (x3). The variables y, x1, and x3 are measured in thousands of dollars per year. The following results were obtaine Source of variation Regression Residual ANOVA Total DF SS k-3 n-k-1-26 W-/- SSR-28 SSE-80 SST- Coefficients Standard Error Intercept 7.58 *1 b1--2.35 0.6379 32 *3 b2-2.5 b3-0.35 0.44 0.25 Refer to Exhibit 1-1. The value of the f statistic for testing whether x, and y are related is a.7.21 b.-1.4 Oc-6.36 Od-3.68
Step by Step Solution
There are 3 Steps involved in it
To find the tstatistic for testing whether x 1 x 1 income a... View full answer

Get step-by-step solutions from verified subject matter experts