

Question: Exit Fullscreen Read through the scenario below and answer the following questions. The following data set is from a survey of the weekly number of
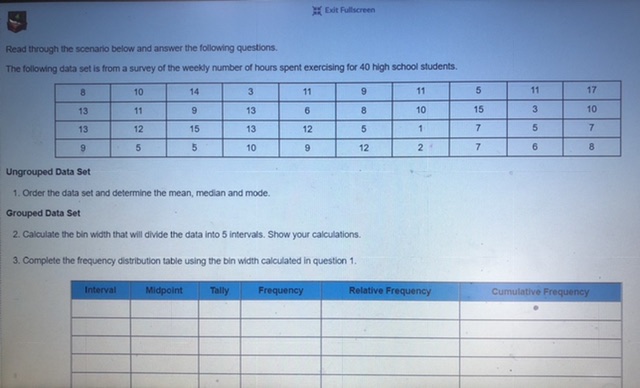
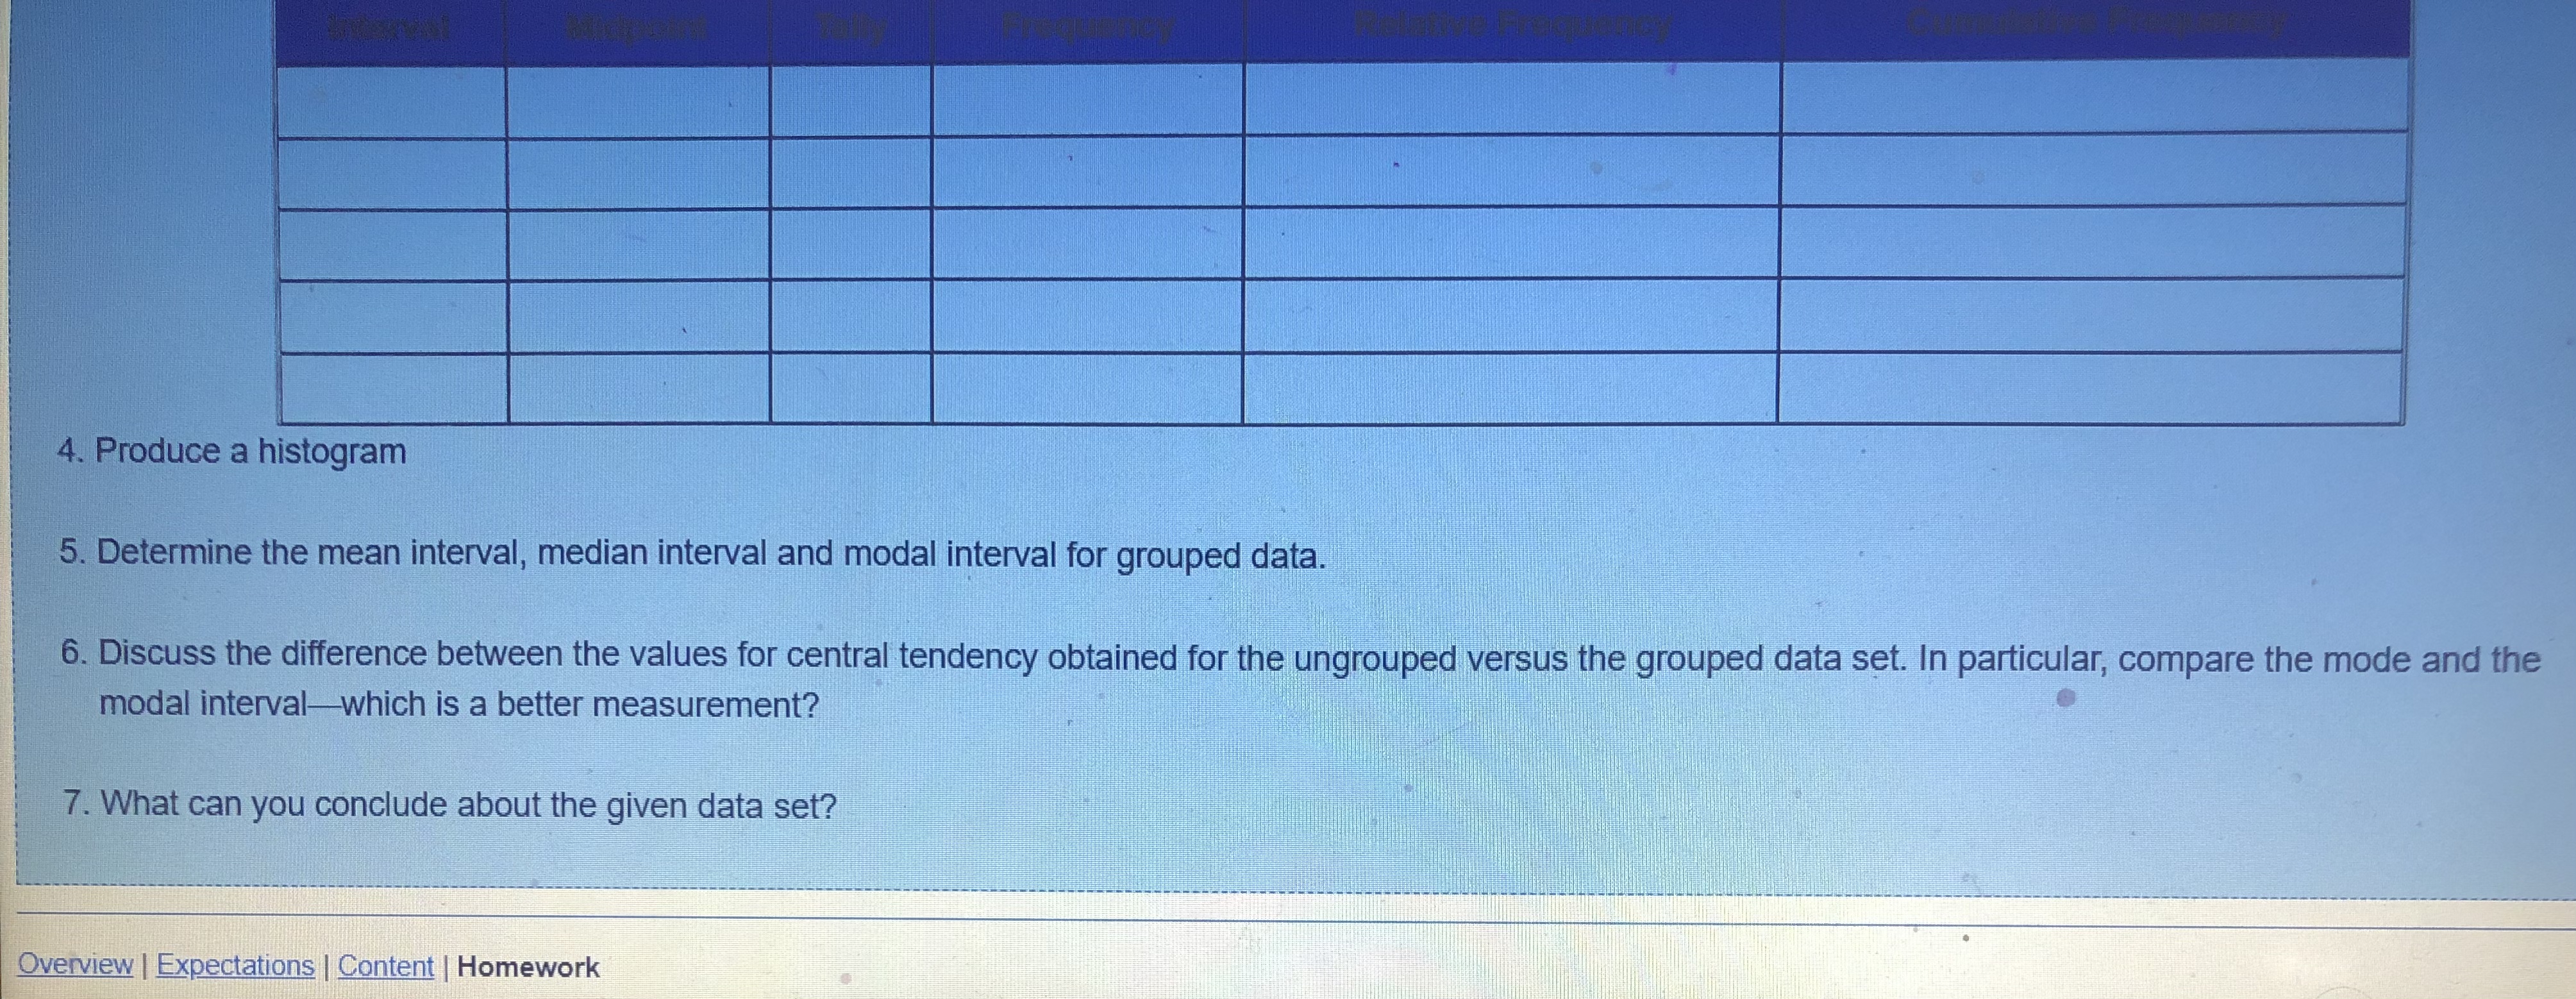
Exit Fullscreen Read through the scenario below and answer the following questions. The following data set is from a survey of the weekly number of hours spent exercising for 40 high school students. 10 14 3 11 11 5 11 17 13 11 9 13 B 10 15 3 10 13 12 15 13 12 5 5 9 5 5 10 12 2 7 Ungrouped Data Set 1. Order the data set and determine the mean, median and mode. Grouped Data Set 2. Calculate the bin width that will divide the data into 5 intervals. Show your calculations. 3. Complete the frequency distribution table using the bin width calculated In question 1. Interval Midpoint Tally Frequency Relative Frequency Cumulative Frequency4. Produce a histogram 5. Determine the mean interval, median interval and modal interval for grouped data. 6. Discuss the difference between the values for central tendency obtained for the ungrouped versus the grouped data set. In particular, compare the mode and the modal interval-which is a better measurement? 7. What can you conclude about the given data set? Overview | Expectations | Content |
Step by Step Solution
There are 3 Steps involved in it

Get step-by-step solutions from verified subject matter experts