

Question: Experimental vapour - liquid equilibrium data for a binary at a constant pressure of 1 0 1 . 3 kPa, are plotted in the figure
Experimental vapourliquid equilibrium data for a binary at a constant pressure of kPa, are plotted in the figure below.
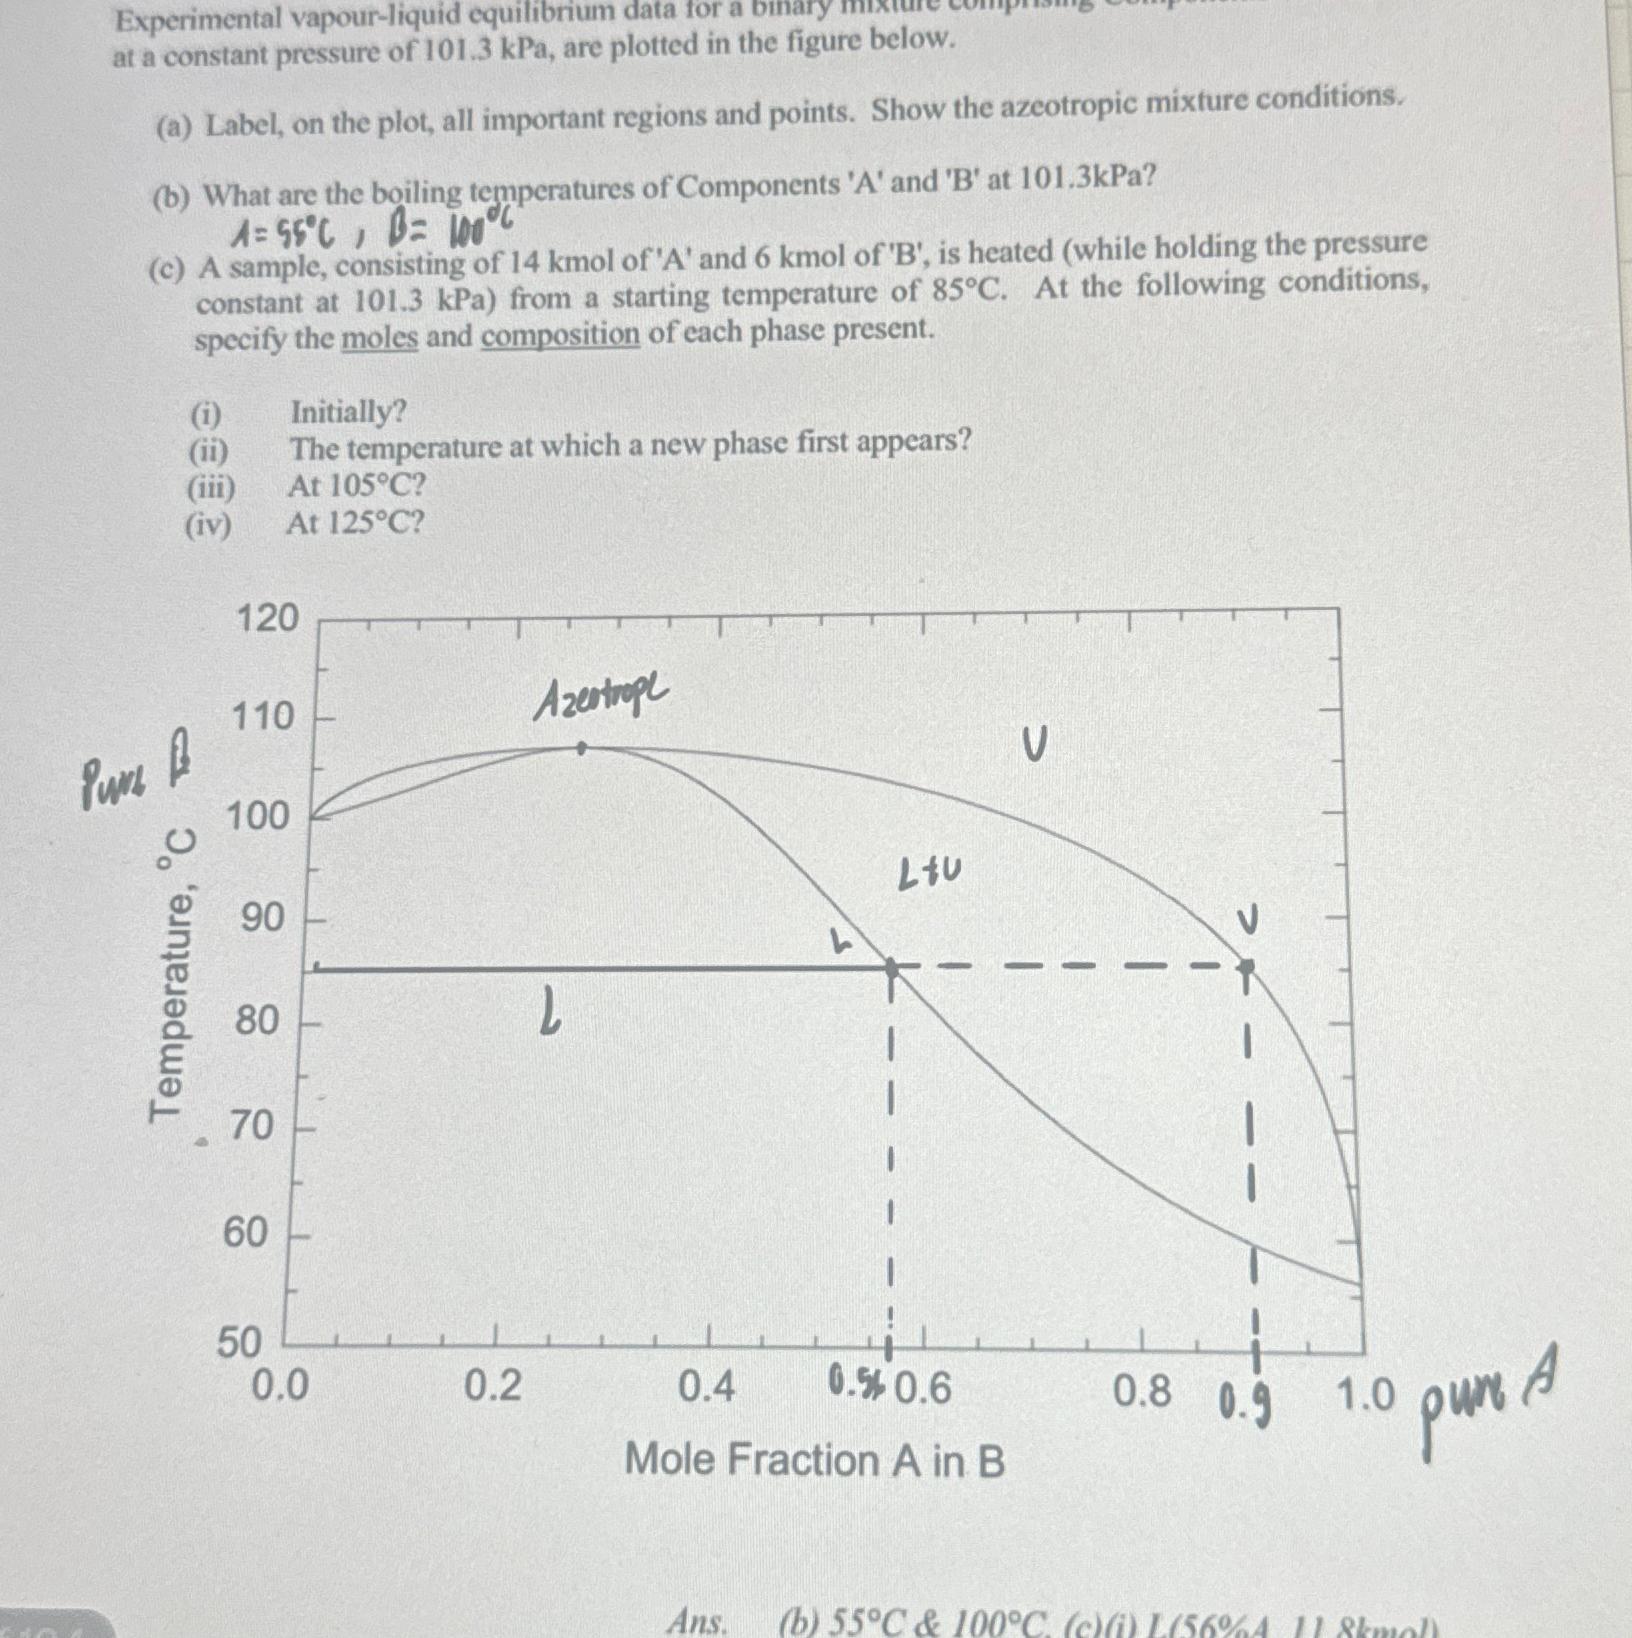
at a constant pressure of kPa, are plotted in the figure below.
a Label, on the plot, all important regions and points. Show the azeotropic mixture conditions.
b What are the boiling temperatures of Components A and at kPa
c A sample, consisting of kmol of A and kmol of B is heated while holding the pressure constant at kPa from a starting temperature of At the following conditions, specify the moles and composition of each phase present.
i Initially?
ii The temperature at which a new phase first appears?
iii At
iv At
Step by Step Solution
There are 3 Steps involved in it
1 Expert Approved Answer
Step: 1 Unlock

Question Has Been Solved by an Expert!
Get step-by-step solutions from verified subject matter experts
Step: 2 Unlock
Step: 3 Unlock