

Question: Explain briefly this bar graph with data? Deposits 100k 50k 0 -50k -100k Green Red Change in deposits Blue Orange Change in deposits il Change
Explain briefly this bar graph with data?
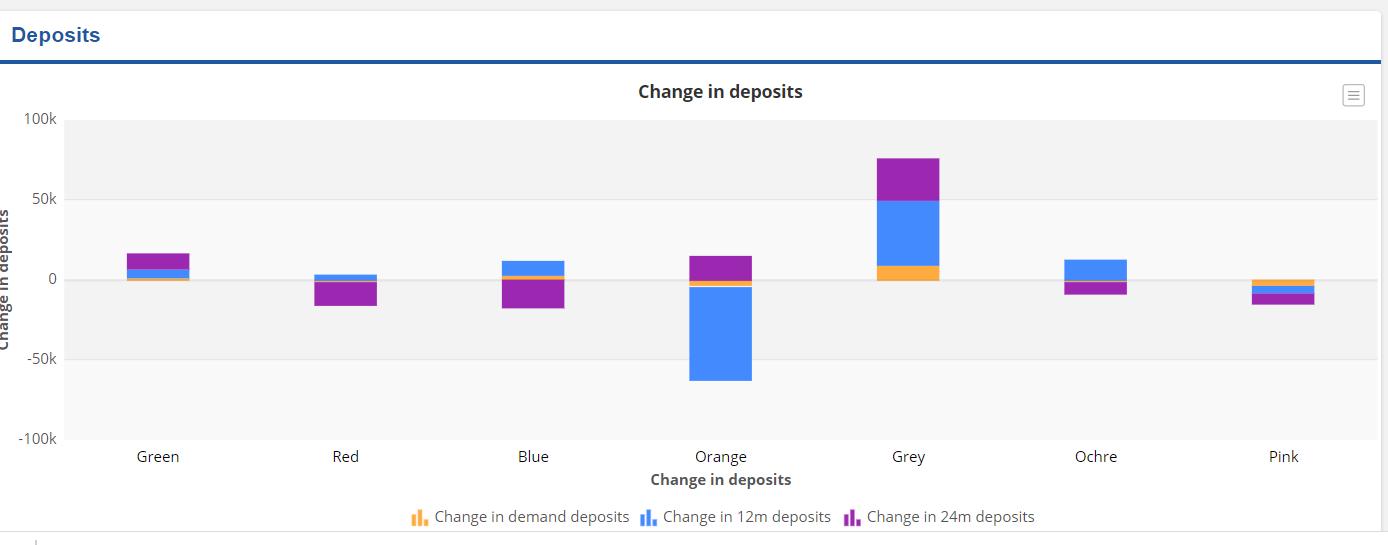
Deposits 100k 50k 0 -50k -100k Green Red Change in deposits Blue Orange Change in deposits il Change in demand deposits II Change in 12m deposits Change in 24m deposits Grey Ochre Pink
Step by Step Solution
★★★★★
3.42 Rating (155 Votes )
There are 3 Steps involved in it
1 Expert Approved Answer
Step: 1 Unlock

The bar graph shows the change in deposits and debt over time The leftmost bar shows the init... View full answer
Question Has Been Solved by an Expert!
Get step-by-step solutions from verified subject matter experts
Step: 2 Unlock
Step: 3 Unlock