

Question: Calibration curve. You can do this exercise with your calculator, but it is more easily done by the spreadsheet in Figure 4-15. In the Bradford
Calibration curve. You can do this exercise with your calculator, but it is more easily done by the spreadsheet in Figure 4-15. In the Bradford protein determination, the color of a dye changes from brown to blue when it binds to protein. Absorbance of light is measured.
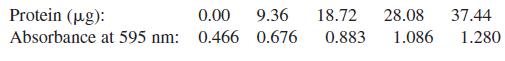
Figure 4-15
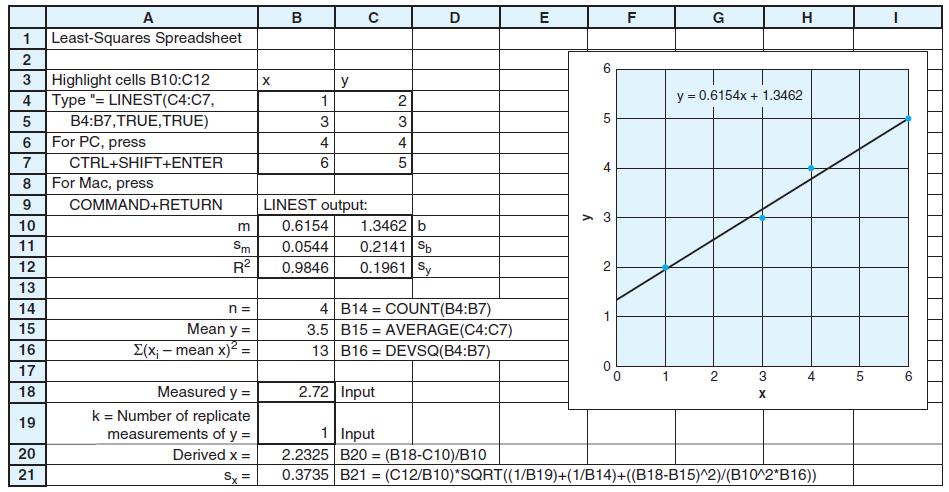
(a) Find the equation of the least-squares straight line through these points in the form y = [m(± sm)]x + [b(±sb)] with a reasonable number of significant figures.
(b) Make a graph showing the experimental data and the calculated straight line.
(c) An unknown protein sample gave an absorbance of 0.973.
Calculate the number of micrograms of protein in the unknown and estimate its uncertainty.
Protein (ug): 0.00 9.36 18.72 28.08 37.44 Absorbance at 595 nm: 0.466 0.676 0.883 1.086 1.280
Step by Step Solution
3.40 Rating (169 Votes )
There are 3 Steps involved in it
a Equation of the leastsquares straight line through ... View full answer

Get step-by-step solutions from verified subject matter experts