

Question: Explain how the below diagram resolves the many to many relationship of PROPERTY to CLIENT by inserting the COMMISION_RATE weak entity into the diagram. N:M-PROPERTY
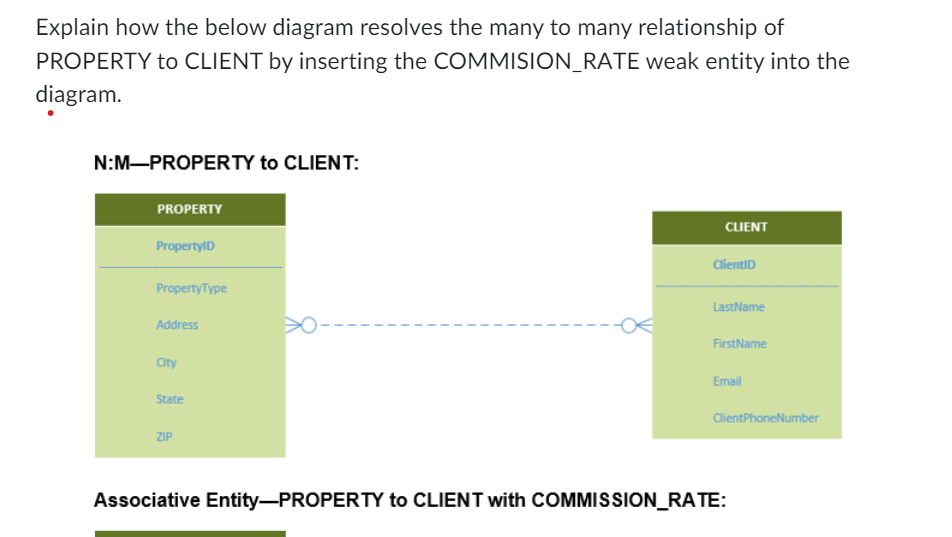
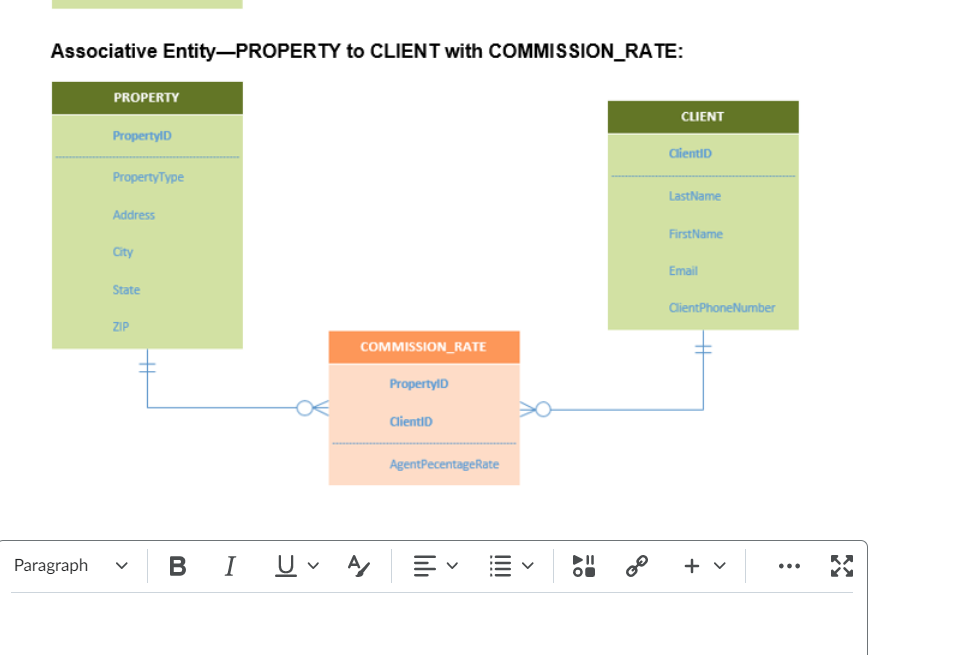
Explain how the below diagram resolves the many to many relationship of PROPERTY to CLIENT by inserting the COMMISION_RATE weak entity into the diagram. N:M-PROPERTY to CLIENT: Associative Entity-PROPERTY to CLIENT with COMMISSION_RATE: Associative Entity-PROPERTY to CLIENT with COMMISSION_RATE: Explain how the below diagram resolves the many to many relationship of PROPERTY to CLIENT by inserting the COMMISION_RATE weak entity into the diagram. N:M-PROPERTY to CLIENT: Associative Entity-PROPERTY to CLIENT with COMMISSION_RATE: Associative Entity-PROPERTY to CLIENT with COMMISSION_RATE
Step by Step Solution
There are 3 Steps involved in it
1 Expert Approved Answer
Step: 1 Unlock

Question Has Been Solved by an Expert!
Get step-by-step solutions from verified subject matter experts
Step: 2 Unlock
Step: 3 Unlock