

Question: explain in detail on how to solve each problem. I need to know how to do them for my upcoming test. show your work Scenario:
explain in detail on how to solve each problem. I need to know how to do them for my upcoming test. show your work
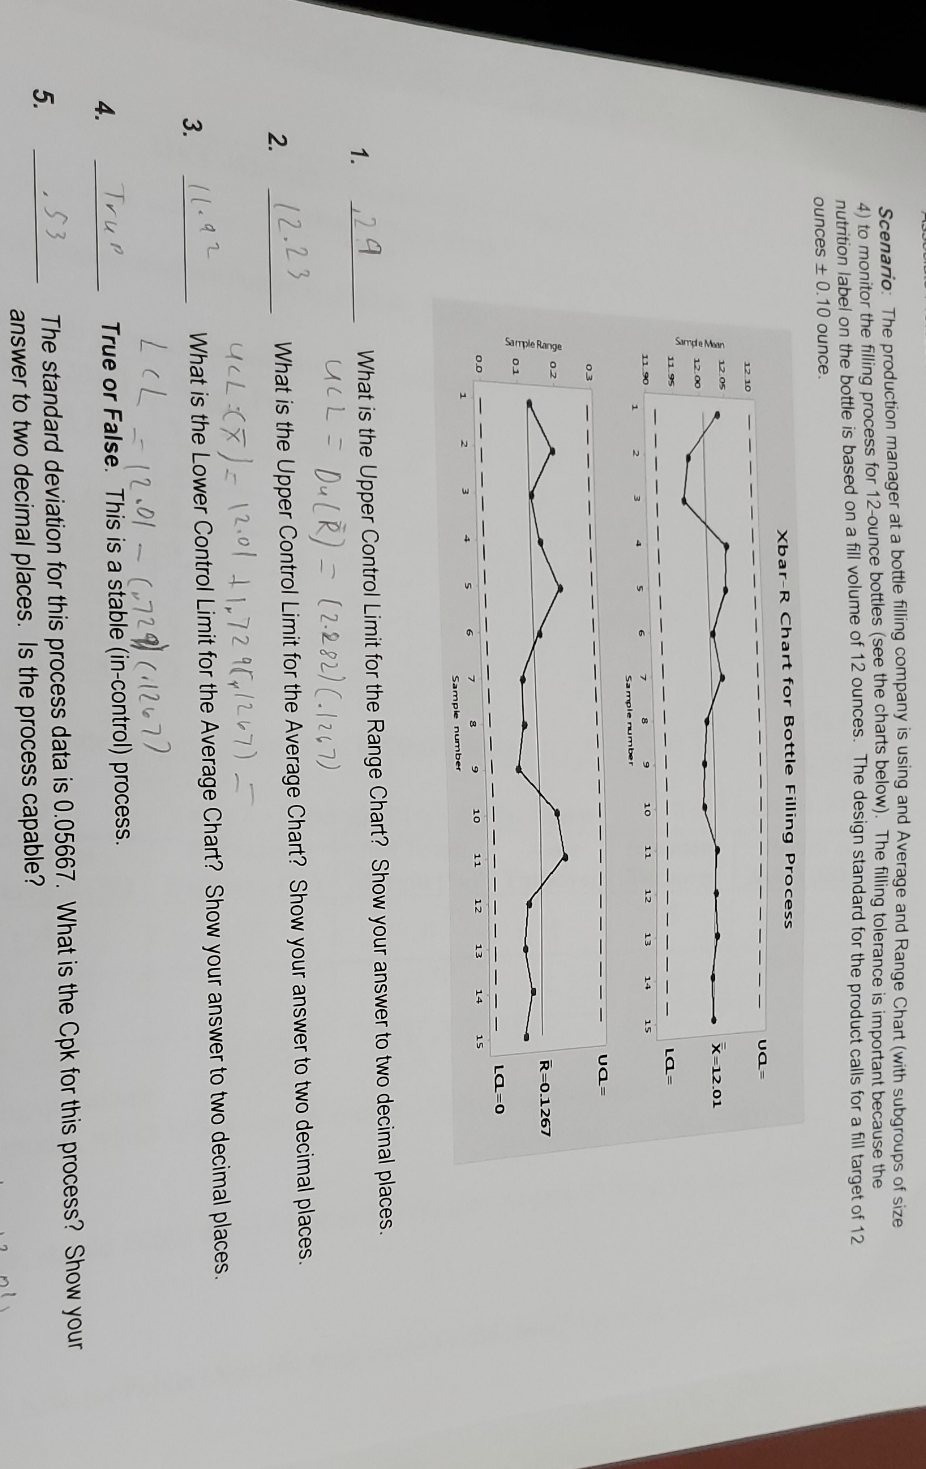
Scenario: The production manager at a bottle filling company is using and Average and Range Chart (with subgroups of size 4) to monitor the filling process for 12-ounce bottles (see the charts below). The filling tolerance is important because the nutrition label on the bottle is based on a fill volume of 12 ounces. The design standard for the product calls for a fill target of 12 ounces + 0.10 ounce. Xbar-R Chart for Bottle Filling Process 12 10 ua= 12.05 12.00 X=12.01 11.95 11 90 La= 8 9 10 11 12 13 14 15 Sample number ua= R=0.1267 01 0.0 La=0 9 10 11 12 13 14 15 Sample number 1 . 29 What is the Upper Control Limit for the Range Chart? Show your answer to two decimal places. UCL = Du (R ) = (2.282) (. 1267) 12.23 What is the Upper Control Limit for the Average Chart? Show your answer to two decimal places. U CL ( X ) = 12. 01 + 1, 72 95x1267 ) - m 1 1 . 92 What is the Lower Control Limit for the Average Chart? Show your answer to two decimal places. LCL -- 12. 01 - ( , 72 9) ( .126 7 ) + Trup True or False. This is a stable (in-control) process. The standard deviation for this process data is 0.05667. What is the Cpk for this process? Show your answer to two decimal places. Is the process capable
Step by Step Solution
There are 3 Steps involved in it

Get step-by-step solutions from verified subject matter experts