

Question: explain in detail on how to solve each problem. I need to know how to do them for my upcoming test. show your work Scenario:
explain in detail on how to solve each problem. I need to know how to do them for my upcoming test. show your work
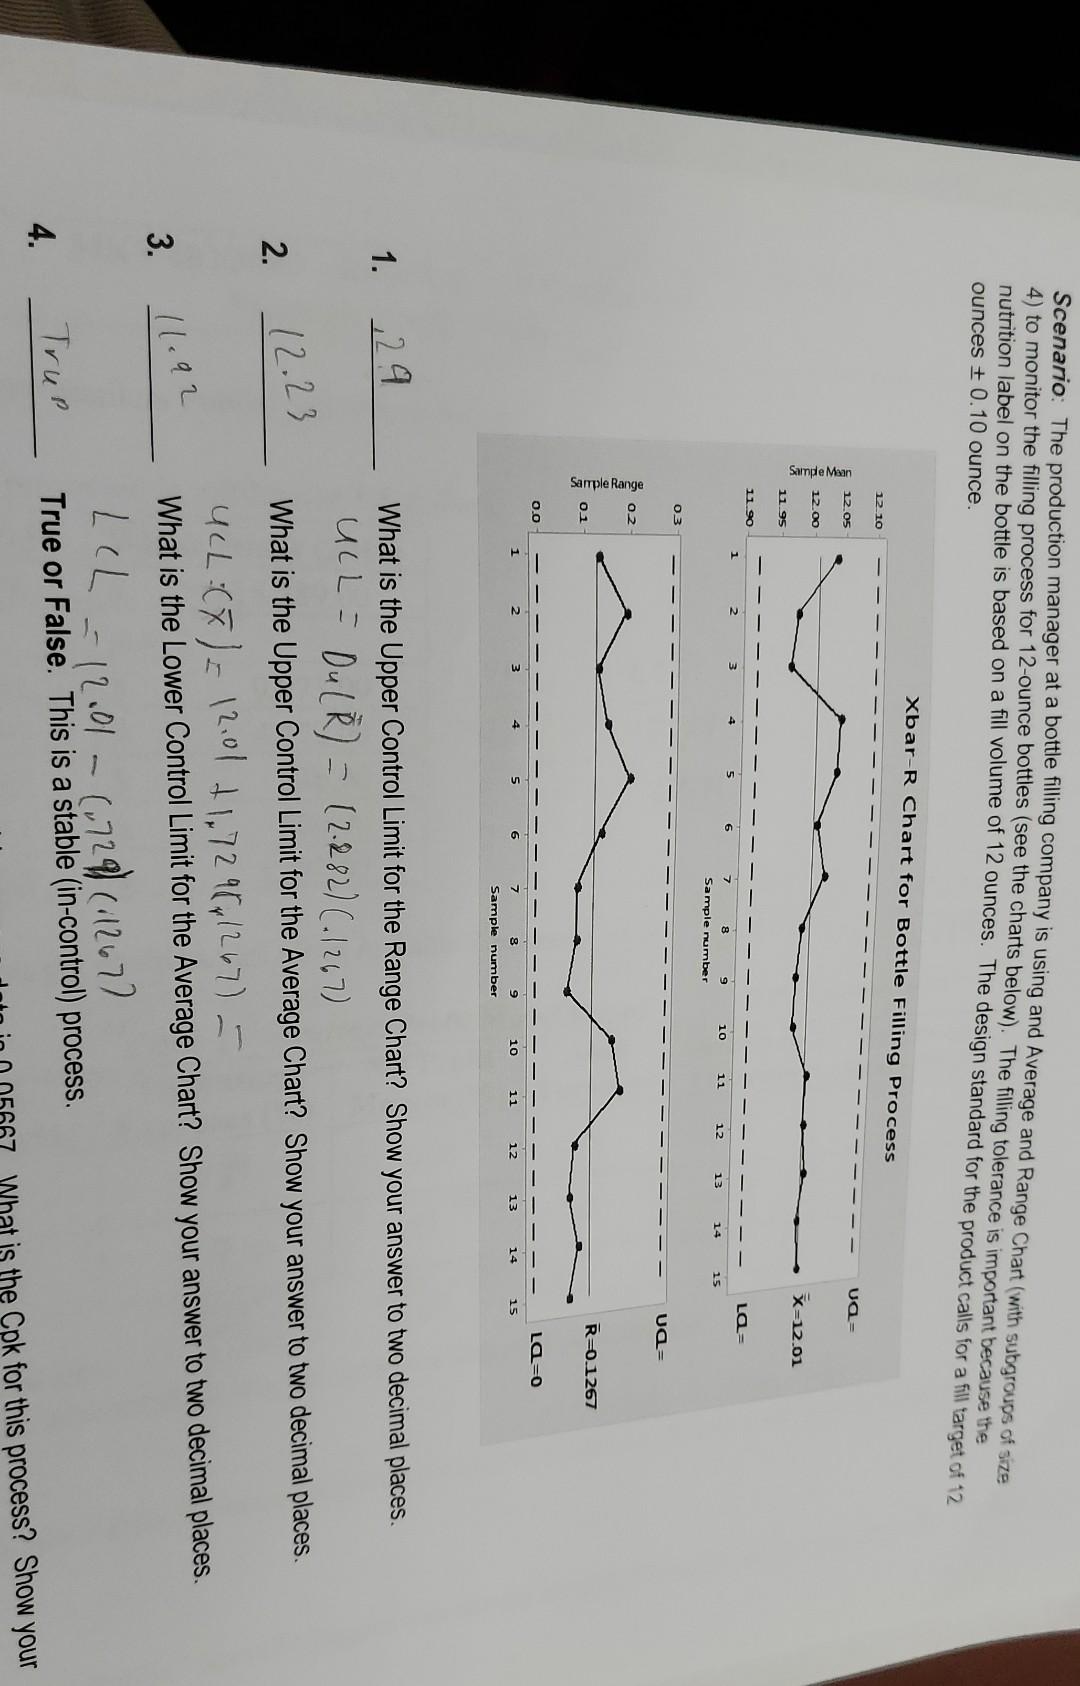
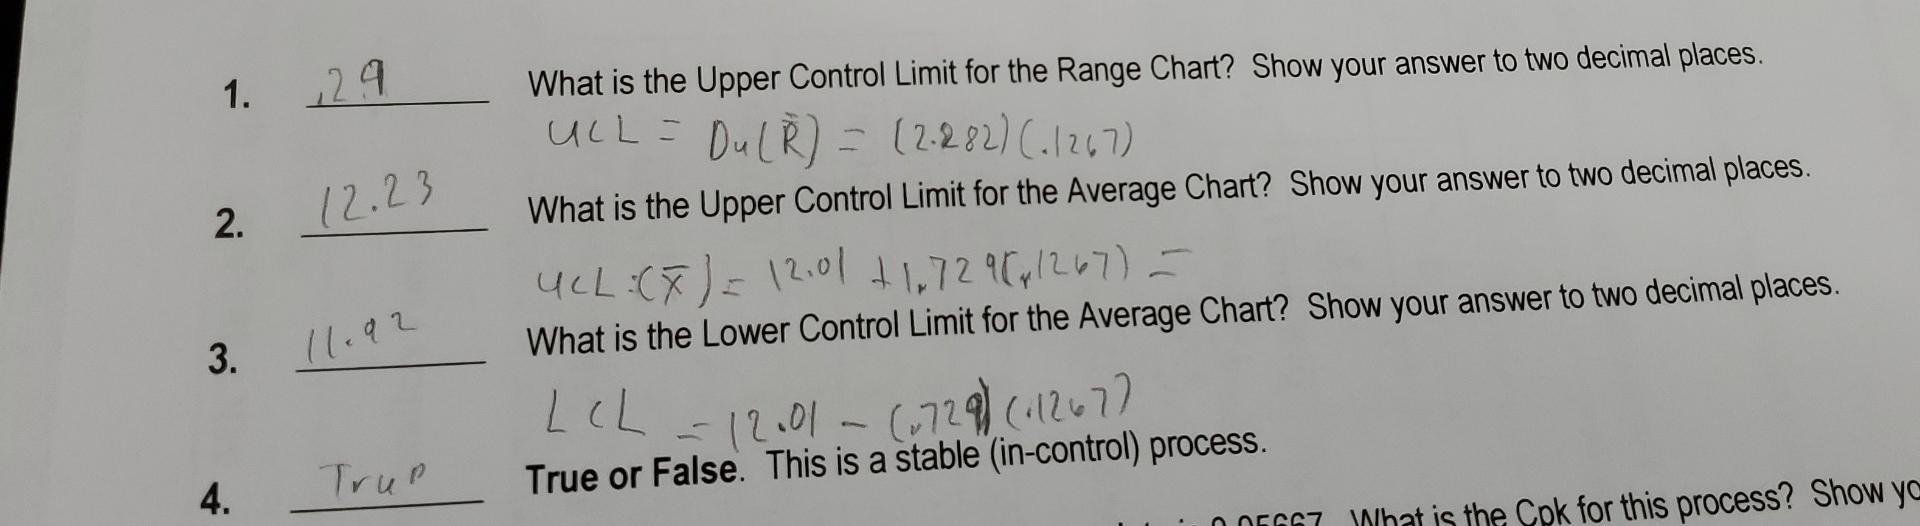
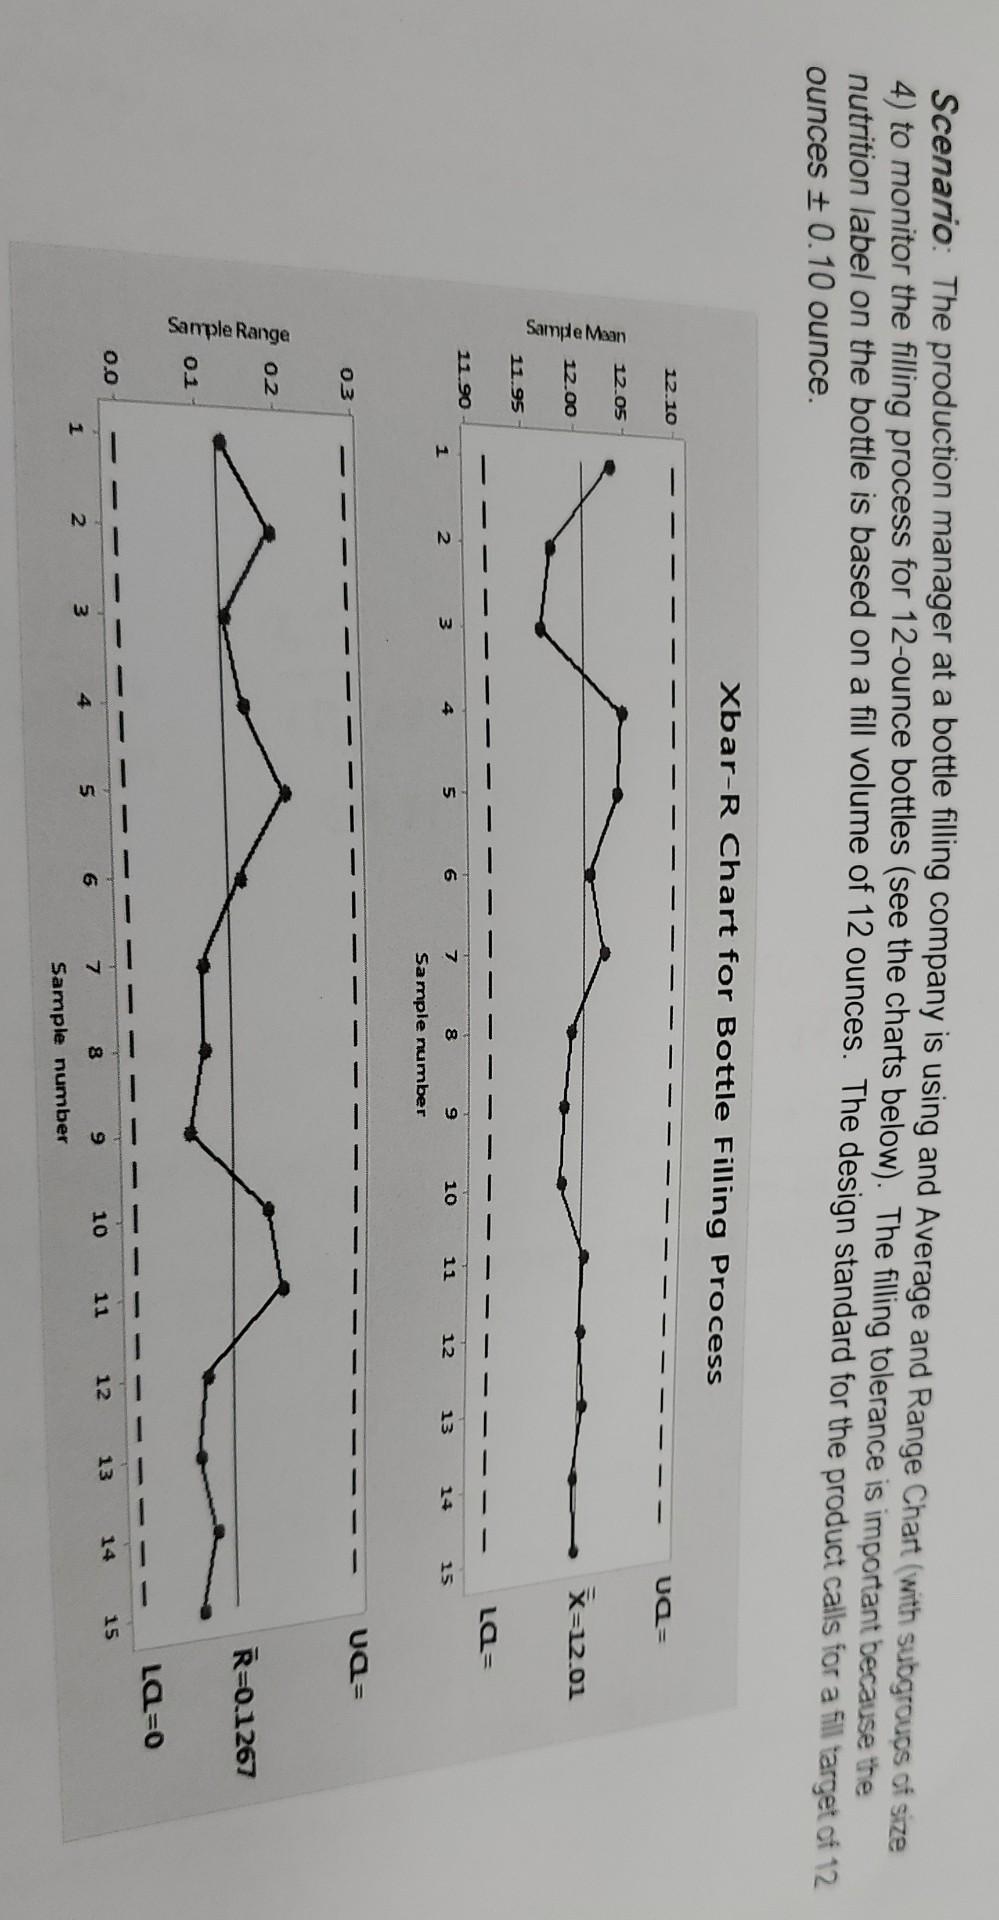
Scenario: The production manager at a bottle filling company is using and Average and Range Chart (with subgroups of size 4) to monitor the filling process for 12-ounce bottles (see the charts below). The filling tolerance is important because the nutrition label on the bottle is based on a fill volume of 12 ounces. The design standard for the product calls for a fill target of 12 ounces + 0.10 ounce. Xbar-R Chart for Bottle Filling Process 12.10 12.05 Ua= Sampe Maan 12.00 x=12.01 11 95 11 90 La= 1 10 8 Sample number 14 15 03 Ua= 02 Sample Range R=0.1267 01 0.0 La=0 10 15 Sample number 1. 29 12.23 2. What is the Upper Control Limit for the Range Chart? Show your answer to two decimal places. ULL - Dul R) = (2.882) (.1267) What is the Upper Control Limit for the Average Chart? Show your answer to two decimal places. ULL:(*) = 12.01 +1,72 98,1267) = What is the Lower Control Limit for the Average Chart? Show your answer to two decimal places. LLL True or False. This is a stable (in-control) process. What is the Cpk for this process? Show your 3. 11.92 = 12001 - (729) (112677 4. Trup 1. 29 2. 12.23 What is the Upper Control Limit for the Range Chart? Show your answer to two decimal places. ULL = Du LR) = (2.282) (.1267) What is the Upper Control Limit for the Average Chart? Show your answer to two decimal places. UCL :(X) = 12.01 +1,72 9841267) - What is the Lower Control Limit for the Average Chart? Show your answer to two decimal places. LCL True or False. This is a stable (in-control) process. GT What is the Cpk for this process? Show yo 3. 11.92 = 12001 -(6729) (1267) 4. Trup Scenario: The production manager at a bottle filling company is using and Average and Range Chart (with subgroups of size 4) to monitor the filling process for 12-ounce bottles (see the charts below). The filling tolerance is important because the nutrition label on the bottle is based on a fill volume of 12 ounces. The design standard for the product calls for a fill target of 12 ounces + 0.10 ounce. Xbar-R Chart for Bottle Filling Process 12.10 UC= 12.05 Sample Maan X=12.01 12.00 1195 La= 11 90 6 3 2 8 7 1 9 10 11 12 13 14 15 Sample number Ua= 03 02 Sample Range R=0.1267 01 0= 0.0 - 15 14 13 12 8. 11 10 9 7 6 5 2 3 Sample number
Step by Step Solution
There are 3 Steps involved in it
1 Expert Approved Answer
Step: 1 Unlock

Question Has Been Solved by an Expert!
Get step-by-step solutions from verified subject matter experts
Step: 2 Unlock
Step: 3 Unlock