

Question: explain to me how to solve this question. Using the data in the following table, and the fact that the correlation of A and B
explain to me how to solve this question.
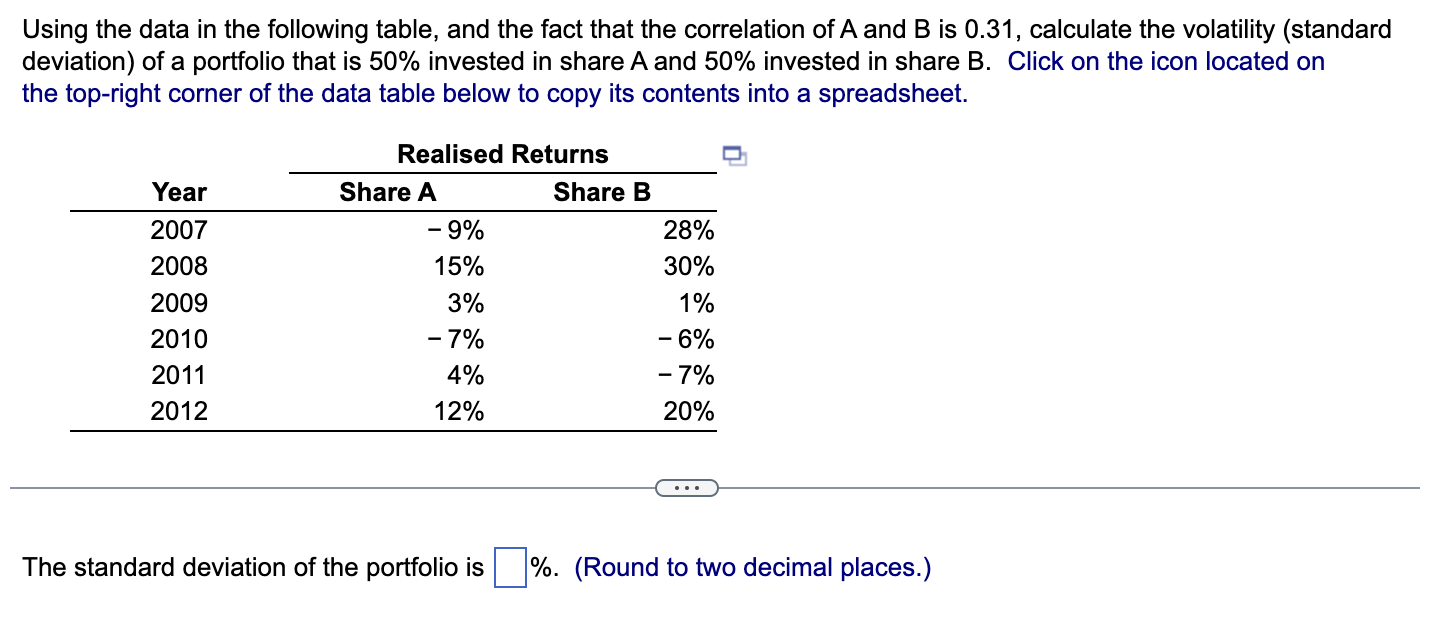
Using the data in the following table, and the fact that the correlation of A and B is 0.31 , calculate the volatility (standard deviation) of a portfolio that is 50% invested in share A and 50% invested in share B. Click on the icon located on the top-right corner of the data table below to copy its contents into a spreadsheet. The standard deviation of the portfolio is \%. (Round to two decimal places.)
Step by Step Solution
There are 3 Steps involved in it
1 Expert Approved Answer
Step: 1 Unlock

Question Has Been Solved by an Expert!
Get step-by-step solutions from verified subject matter experts
Step: 2 Unlock
Step: 3 Unlock