

Question: Using the data in the following table, and the fact that the correlation of A and B is 0 . 2 9 , calculate the
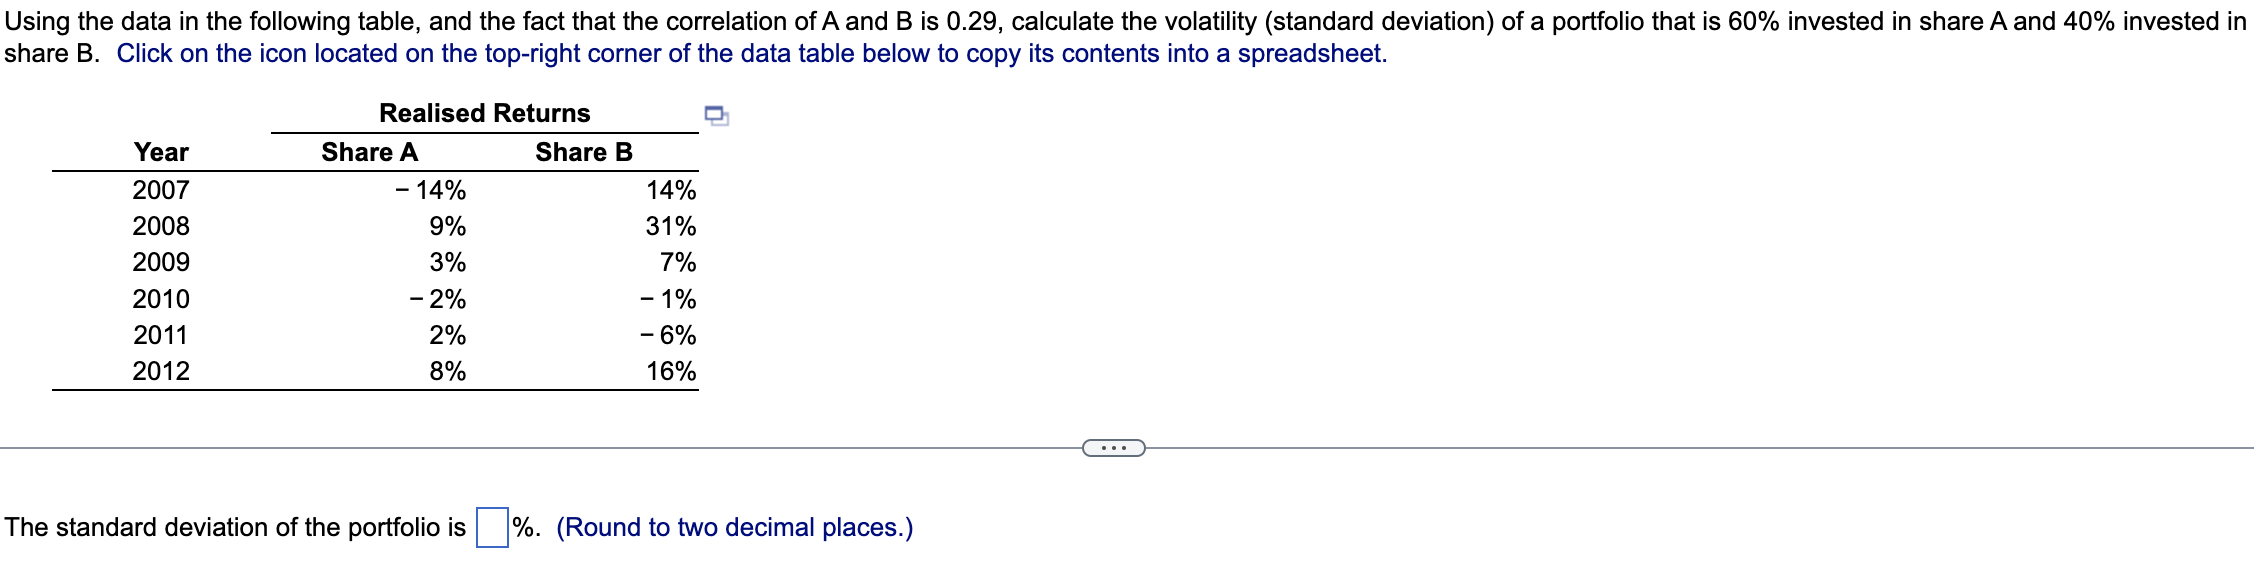
Using the data in the following table, and the fact that the correlation of A and B is calculate the volatilitystandard deviation of a portfolio that is invested in share A and invested in share BClick on the icon located on the topright corner of the data table below to copy its contents into a spreadsheet.
Realised Returns
Year
Share A
Share B
negative
negative
negative
negative
Question content area bottom
Part
The standard deviation of the portfolio is
enter your response hereRound to two decimal places. Using the data in the following table, and the fact that the correlation of A and B is calculate the volatility standard deviation of a portfolio that is invested in share A and invested in
share B Click on the icon located on the topright corner of the data table below to copy its contents into a spreadsheet.
Step by Step Solution
There are 3 Steps involved in it
1 Expert Approved Answer
Step: 1 Unlock

Question Has Been Solved by an Expert!
Get step-by-step solutions from verified subject matter experts
Step: 2 Unlock
Step: 3 Unlock