

Question: Explain why the funnel data in Fig. 2.1-3 curve downwards. 1.10 Funnel Specific gravity 1.05 Tube NE 0 2 4 6 Distance z Fig. 2.1-3.
Explain why the funnel data in Fig. 2.1-3 curve downwards.
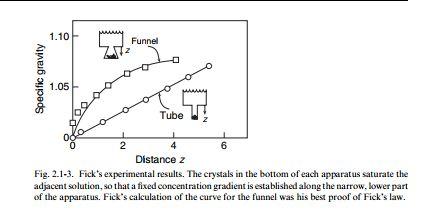
1.10 Funnel Specific gravity 1.05 Tube NE 0 2 4 6 Distance z Fig. 2.1-3. Fick's experimental results. The crystals in the bottom of each apparatus saturate the adjacent solution, so that a fixed concentration gradient is established along the narrow.lower part of the apparatus. Fick's calculation of the curve for the funnel was his best proof of Fick's law
Step by Step Solution
There are 3 Steps involved in it
1 Expert Approved Answer
Step: 1 Unlock

Question Has Been Solved by an Expert!
Get step-by-step solutions from verified subject matter experts
Step: 2 Unlock
Step: 3 Unlock