

Question: Explanation and step-by-step solution 28. (a) Determine the mean, median, and mode of the data in the dot plot shown. (b) Does the mean, median,
Explanation and step-by-step solution
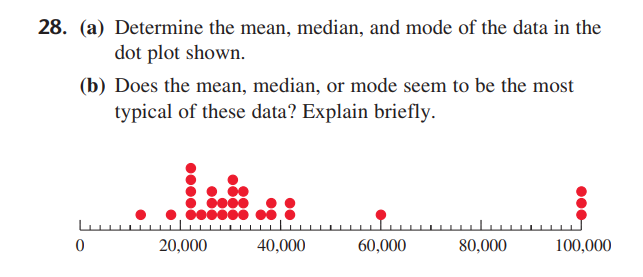
28. (a) Determine the mean, median, and mode of the data in the dot plot shown. (b) Does the mean, median, or mode seem to be the most typical of these data? Explain briefly. 20,000 40,000 60,000 80,000 100,000
Step by Step Solution
There are 3 Steps involved in it
1 Expert Approved Answer
Step: 1 Unlock

Question Has Been Solved by an Expert!
Get step-by-step solutions from verified subject matter experts
Step: 2 Unlock
Step: 3 Unlock