

Question: Explanations and steps please Sample Excel exercise Given the following statistics of three stocks, create a portfolio that has the greatest Sharpe ratio with short
Explanations and steps please
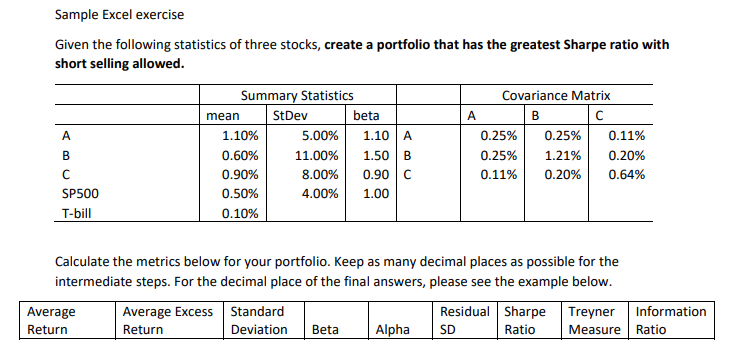
Sample Excel exercise Given the following statistics of three stocks, create a portfolio that has the greatest Sharpe ratio with short selling allowed. Covariance Matrix | 1.10A 0.25% 0.25% | Summary Statistics mean StDev beta 1.10% 5.00% 0.60% 11.00% 1.50 0.90% 8.00% 0.90 0.50% 4.00% 1.00 0.10% 0.25% 0.11% 0.20% 0.64% 0.11% 0.20% SP500 T-bill Calculate the metrics below for your portfolio. Keep as many decimal places as possible for the intermediate steps. For the decimal place of the final answers, please see the example below. Average Average Excess Standard Residual Sharpe Treyner Information Return Return Deviation Beta Alpha SD Ratio Measure Ratio Sample Excel exercise Given the following statistics of three stocks, create a portfolio that has the greatest Sharpe ratio with short selling allowed. Covariance Matrix | 1.10A 0.25% 0.25% | Summary Statistics mean StDev beta 1.10% 5.00% 0.60% 11.00% 1.50 0.90% 8.00% 0.90 0.50% 4.00% 1.00 0.10% 0.25% 0.11% 0.20% 0.64% 0.11% 0.20% SP500 T-bill Calculate the metrics below for your portfolio. Keep as many decimal places as possible for the intermediate steps. For the decimal place of the final answers, please see the example below. Average Average Excess Standard Residual Sharpe Treyner Information Return Return Deviation Beta Alpha SD Ratio Measure Ratio
Step by Step Solution
There are 3 Steps involved in it

Get step-by-step solutions from verified subject matter experts