

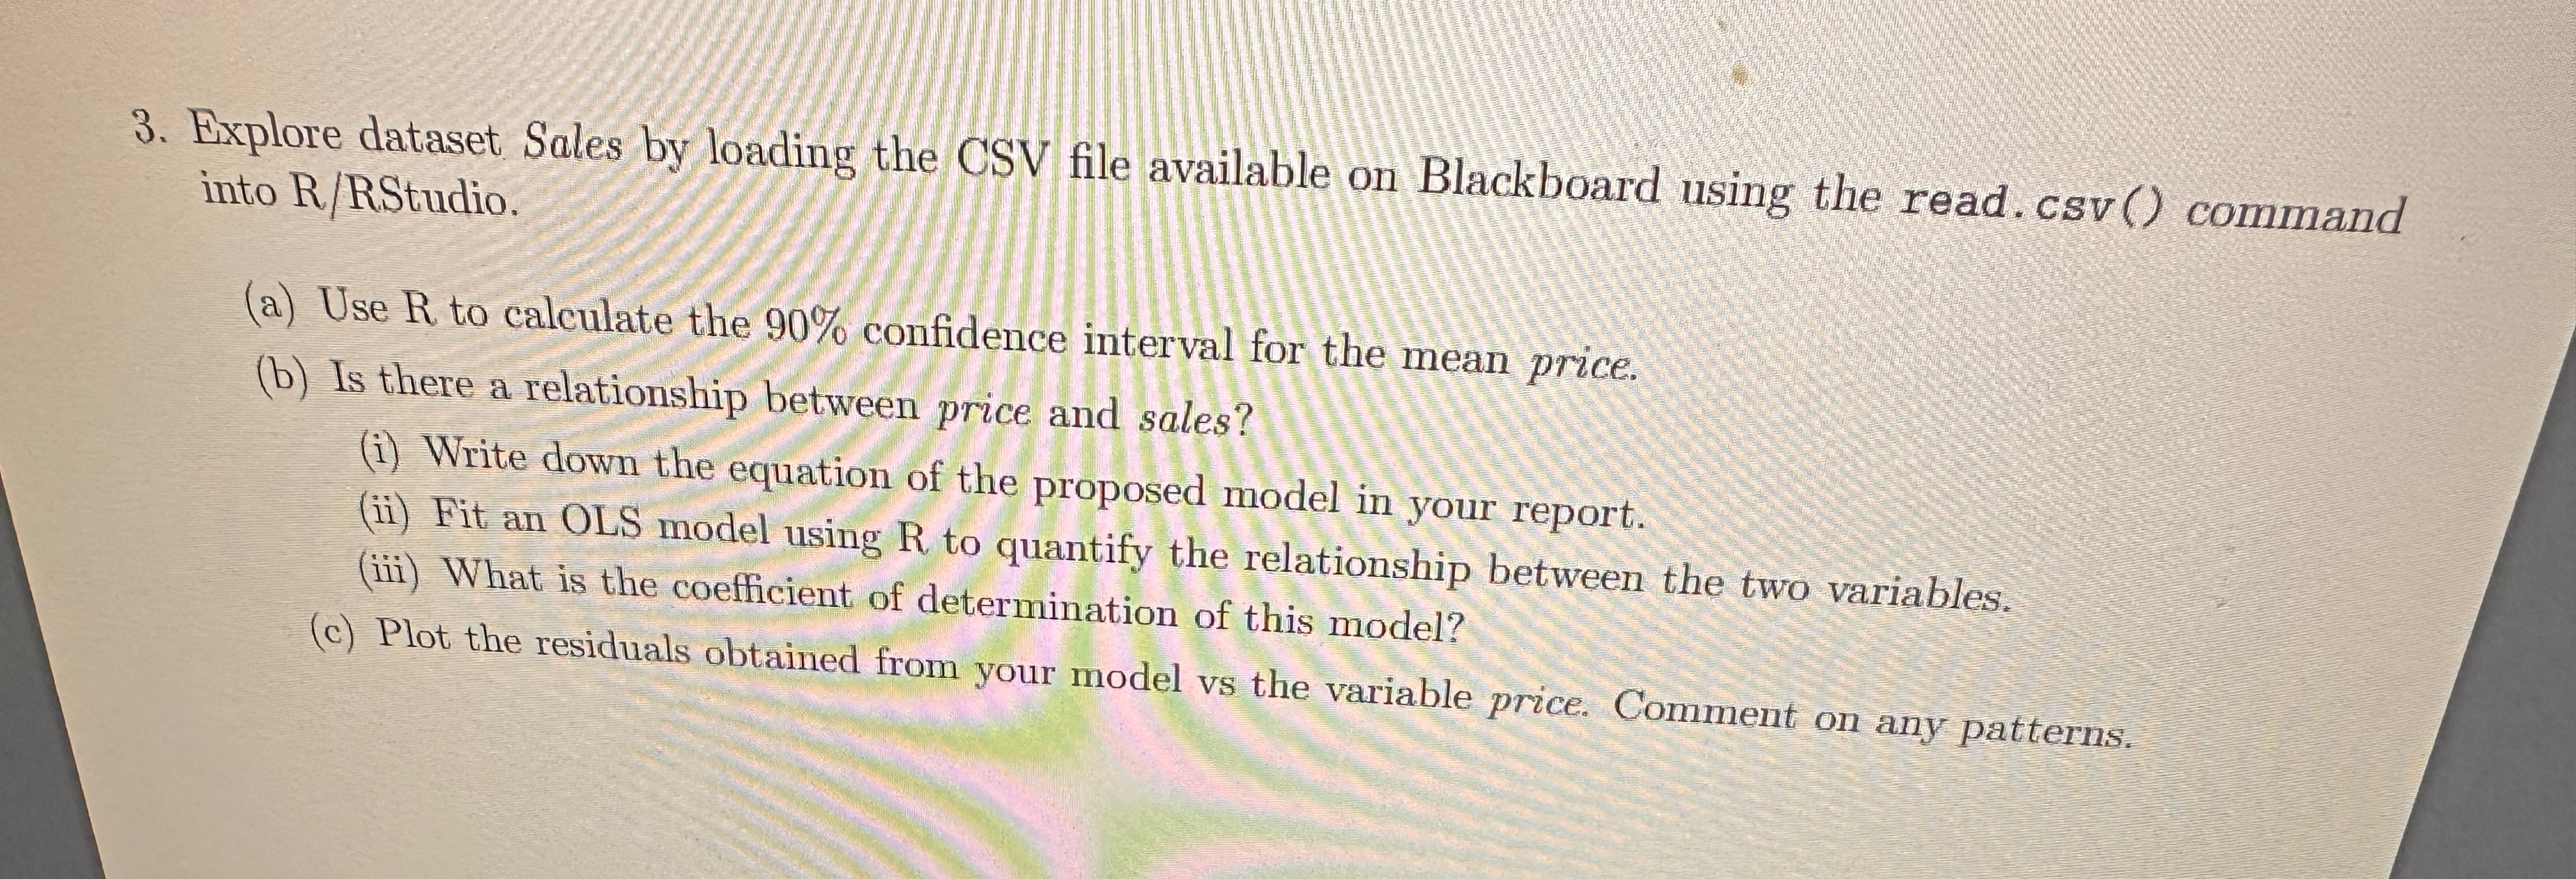
Question: Explore dataset Sales by loading the CSV file available on Blackboard using the read.csv ( ) command into R / RStudio . ( a )
Explore dataset Sales by loading the CSV file available on Blackboard using the read.csv command into RRStudio
a Use R to calculate the confidence interval for the mean price.
b Is there a relationship between price and sales?
i Write down the equation of the proposed model in your report.
ii Fit an OLS model using to quantify the relationship between the two variables.
iii What is the coefficient of determination of this model?
c Plot the residuals obtained from your model vs the variable price. Comment on any patterns.
Please write the r code
Step by Step Solution
There are 3 Steps involved in it
1 Expert Approved Answer
Step: 1 Unlock

Question Has Been Solved by an Expert!
Get step-by-step solutions from verified subject matter experts
Step: 2 Unlock
Step: 3 Unlock