

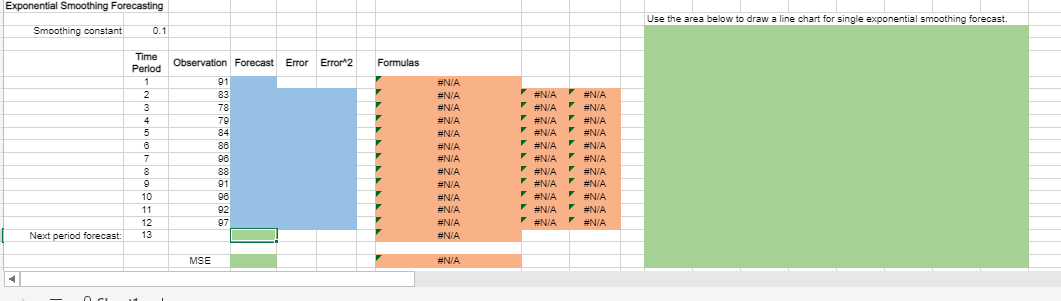
Question: Exponential Smoothing Forecasting Use the area below to draw a line chart for single exponential smoothing forecast. Smoothing constant 0.1 Observation Forecast Error Error2 Formulas
Step by Step Solution
There are 3 Steps involved in it
1 Expert Approved Answer
Step: 1 Unlock

Question Has Been Solved by an Expert!
Get step-by-step solutions from verified subject matter experts
Step: 2 Unlock
Step: 3 Unlock