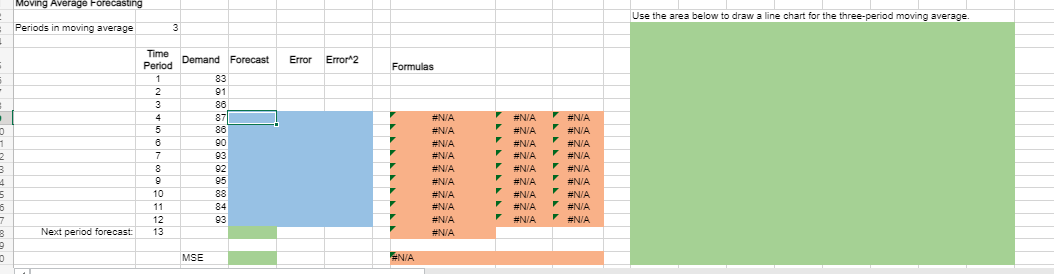
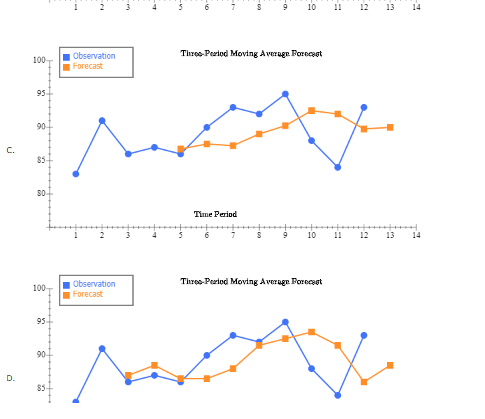
Question: Moving Average Forecasting Use the area below to draw a line chart for the three-period moving average Periods in moving average 3 . Error Error2

Moving Average Forecasting Use the area below toMoving Average Forecasting Use the area below to

Moving Average Forecasting Use the area below toMoving Average Forecasting Use the area below toMoving Average Forecasting Use the area below to

Moving Average Forecasting Use the area below to

Moving Average Forecasting Use the area below to

Moving Average Forecasting Use the area below to

Moving Average Forecasting Use the area below to draw a line chart for the three-period moving average Periods in moving average 3 . Error Error2 Formulas Time Period 1 2 3 4 5 F Demand Forecast 83 91 86 87 86 90 93 92 95 88 84 93 F . 0 1 1 2 3 4 5 6 7 B F #N/A #N/A #N/A #N/A #N/A #N/A #N/A #N/A #N/A #N/A #N/A #N/A #N/A #N/A #N/A #N/A #N/A =N/A #N/A 7 8 9 10 11 12 13 #N/A A #N/A #N/A #N/A #NA #N/A #N/A #N/A #N/A F F F F Next period forecast: 0 MSE #N/A Periods in moving average 4 Error Error2 Time Period 1 2 3 4 5 8 7 8 9 10 11 12 13 Demand Forecast 83 91 86 87 86 90 93 92 95 88 84 93 #N/A #N/A #N NA ENIA F F #N/A #N/A #N/A #N/A #N/A #N/A #N/A #N/A #N/A #N/A #N/A #N/A #N/A #N/A #N/A #N/A #N/A F #N/A #N/A NA #NIA Next period forecast: MSE AN/A Excel Online Activity: Moving Average A retail store records customer demand during each sales period. The data has been collected in the Microsoft Excel Online file below. Use the Microsoft Excel Online file below to develop three-period and four-period moving average forecasts and answer the following questions. Open spreadsheet Questions 1. What is the forecast for the 13th period based on the three-period moving average? Round your answer to two decimal places. 2. What is the MSE for the three-period moving average? Round your answer to two decimal places. 3. Choose the correct graph for the three-period moving average forecast. The correct graph is 100 Observation Forecast Thres Period Moving Average Forecast 95 90 A. 85 80 Time Potlod S 10 11 12 13 14 100 Observation Forecast Three Period Moving Average Forecast 95 90 B. 35 SO Time Period 2 9 10 11 12 13 14 Three Perlod Moving Average Forect 100 Observation Forecast 95 90 C. 85 SO Time Period 9 10 12 13 14 100 Observation Forecast Thres Polod Moving Average Forecast 95 90 D. 85 Tume Period 10 12 13 14 4. What is the forecast for the 13th period based on the four-period moving average? Round your answer to two decimal places. 5. What is the MSE for the four-period moving average? Round your answer to two decimal places. 6. Choose the correct graph for the four-period moving average forecast. The correct graph is Three Pelod Moving Average Toront 100 Observation Forecast 95 90 A. 35 SO Time Period 6 S 10 1: 12 13 14 100 Observation Forecast The Perial Yuria Arte Facial 95 90 85 9 10 11 12 13 14 100 Observation Forecast The Perial Yuria Arte Facial 95- 904 85 90 Mae Podled 6 10 11 12 13 14 100 senation Forecast Thurse Puiel Muring Average Fantasi 95 c. 10 11 12 13 14 100 Observation Forecast The Period Murise ArcaFardlari 95- 85 00+ 10 11 12 13 14 7. Which forecast is the best based on the MSE vala

Step by Step Solution

There are 3 Steps involved in it

1 Expert Approved Answer
Step: 1 Unlock blur-text-image
Question Has Been Solved by an Expert!

Get step-by-step solutions from verified subject matter experts

Step: 2 Unlock
Step: 3 Unlock

Students Have Also Explored These Related General Management Questions!