

Question: 1) UNDER PRESIDENT OBAMA, MORE STUDENTS ARE EARNING THEIR HIGH SCHOOL DIPLOMAS THAN EVER BEFORE SCHOOL .Describe at least two misleading elements of this

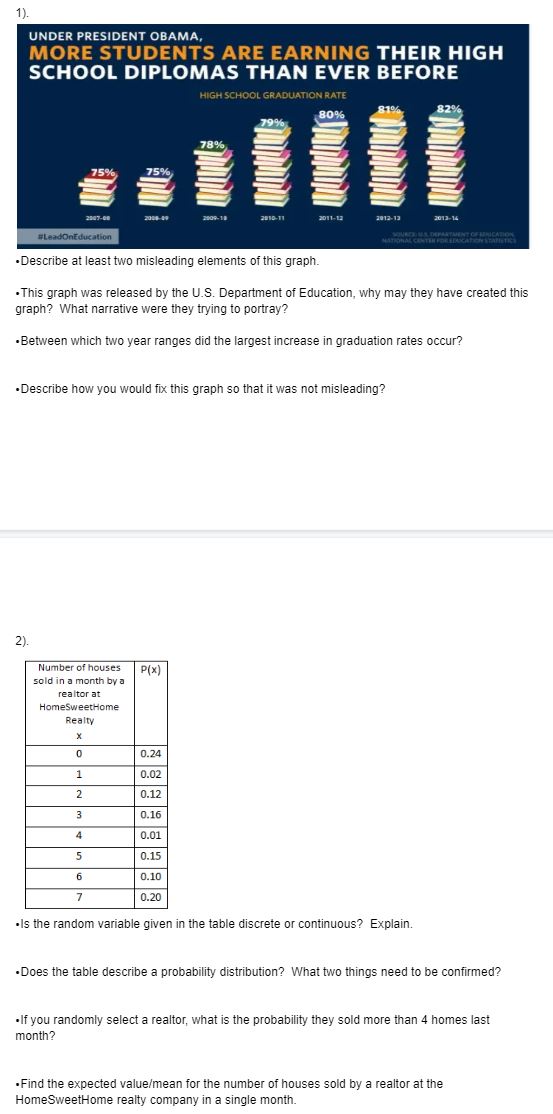
1) UNDER PRESIDENT OBAMA, MORE STUDENTS ARE EARNING THEIR HIGH SCHOOL DIPLOMAS THAN EVER BEFORE SCHOOL .Describe at least two misleading elements of this graph. .This graph was released by the IJ_S. Department of Education, why may they have created this graph? What narrative were they trying to portray? .Between which two year ranges did the largest increase in graduation rates occur? .Describe how you would fix this graph so that it was not misleading? 2). Number Of 0.02 0.16 0.01 0.10 .1s the random variable given in the table discrete or continuous? Explain. .Does the table describe a probability distribution? What two things need to be confirmed? .1f you randomly select a realtor, what is the probability they sold more than 4 homes last month? Find the expected value/mean for the number of houses sold by a realtor at the HomeSweetHome realty company in a single month.
Step by Step Solution
There are 3 Steps involved in it

Get step-by-step solutions from verified subject matter experts