

Question: use the same scales to construct modified boxplots for the pulse rates of males and females from the accompanying data sets. Identify any outliers.
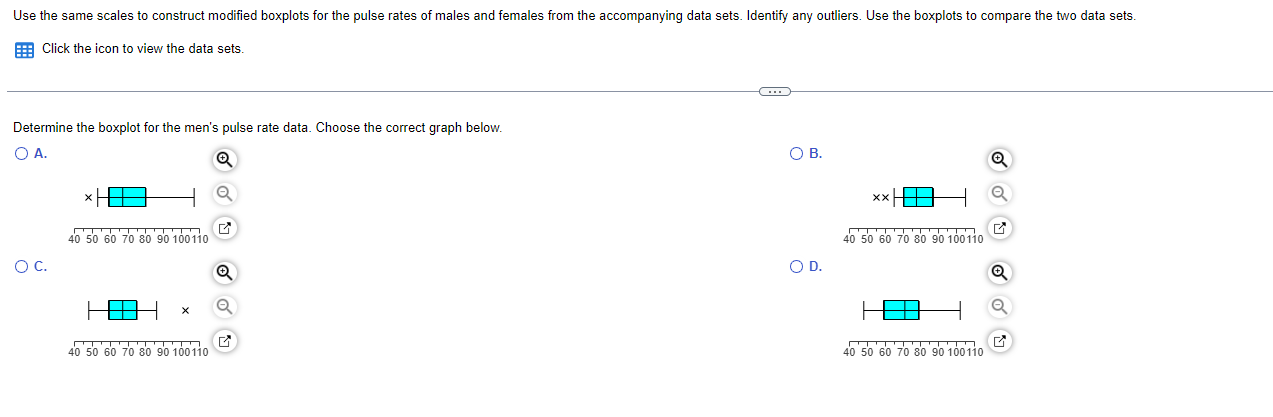

use the same scales to construct modified boxplots for the pulse rates of males and females from the accompanying data sets. Identify any outliers. Use the boxplots to compare the two data sets. Click the icon to view the data sets. Determine the boxplot for the men's pulse rate data. Choose the correct graph below. 40 so 60 70 80 90 100110 40 so 60 70 80 90 100110 40 so 60 70 80 90 100110 40 so 60 70 80 90 100110
Step by Step Solution
There are 3 Steps involved in it
1 Expert Approved Answer
Step: 1 Unlock

Question Has Been Solved by an Expert!
Get step-by-step solutions from verified subject matter experts
Step: 2 Unlock
Step: 3 Unlock