

Question: For questions 6-10, use the graph below: 100 70 40 10 100 200 300 400 700
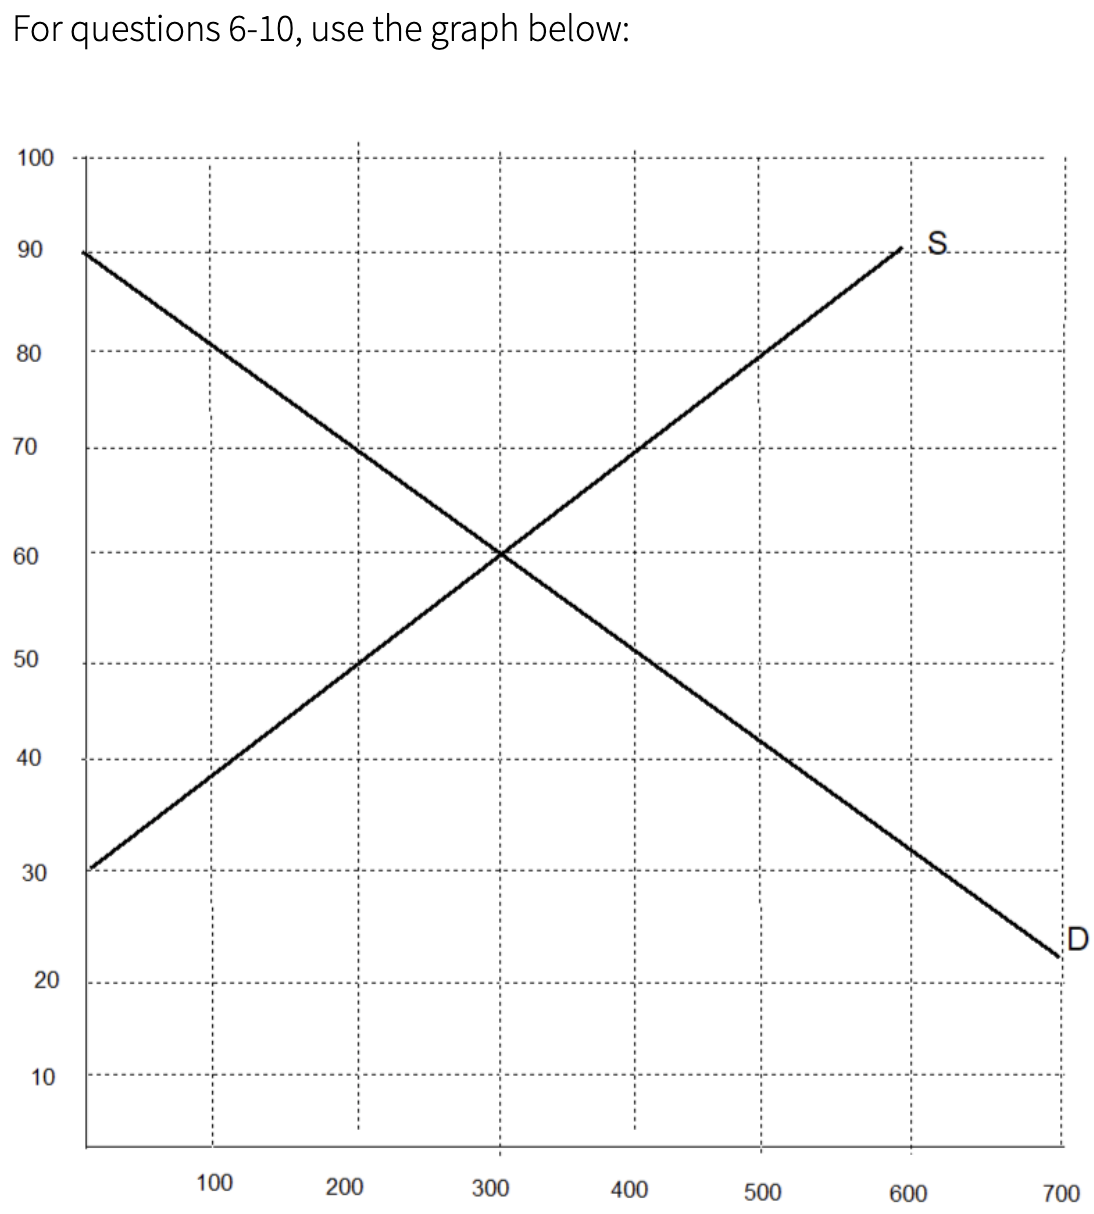

For questions 6-10, use the graph below: 100 70 40 10 100 200 300 400 700
Step by Step Solution
There are 3 Steps involved in it
1 Expert Approved Answer
Step: 1 Unlock

Question Has Been Solved by an Expert!
Get step-by-step solutions from verified subject matter experts
Step: 2 Unlock
Step: 3 Unlock