

Question: f. Based on your data, what would the pressure be at a depth of 95 meters? g. Based on your data or graph, what is
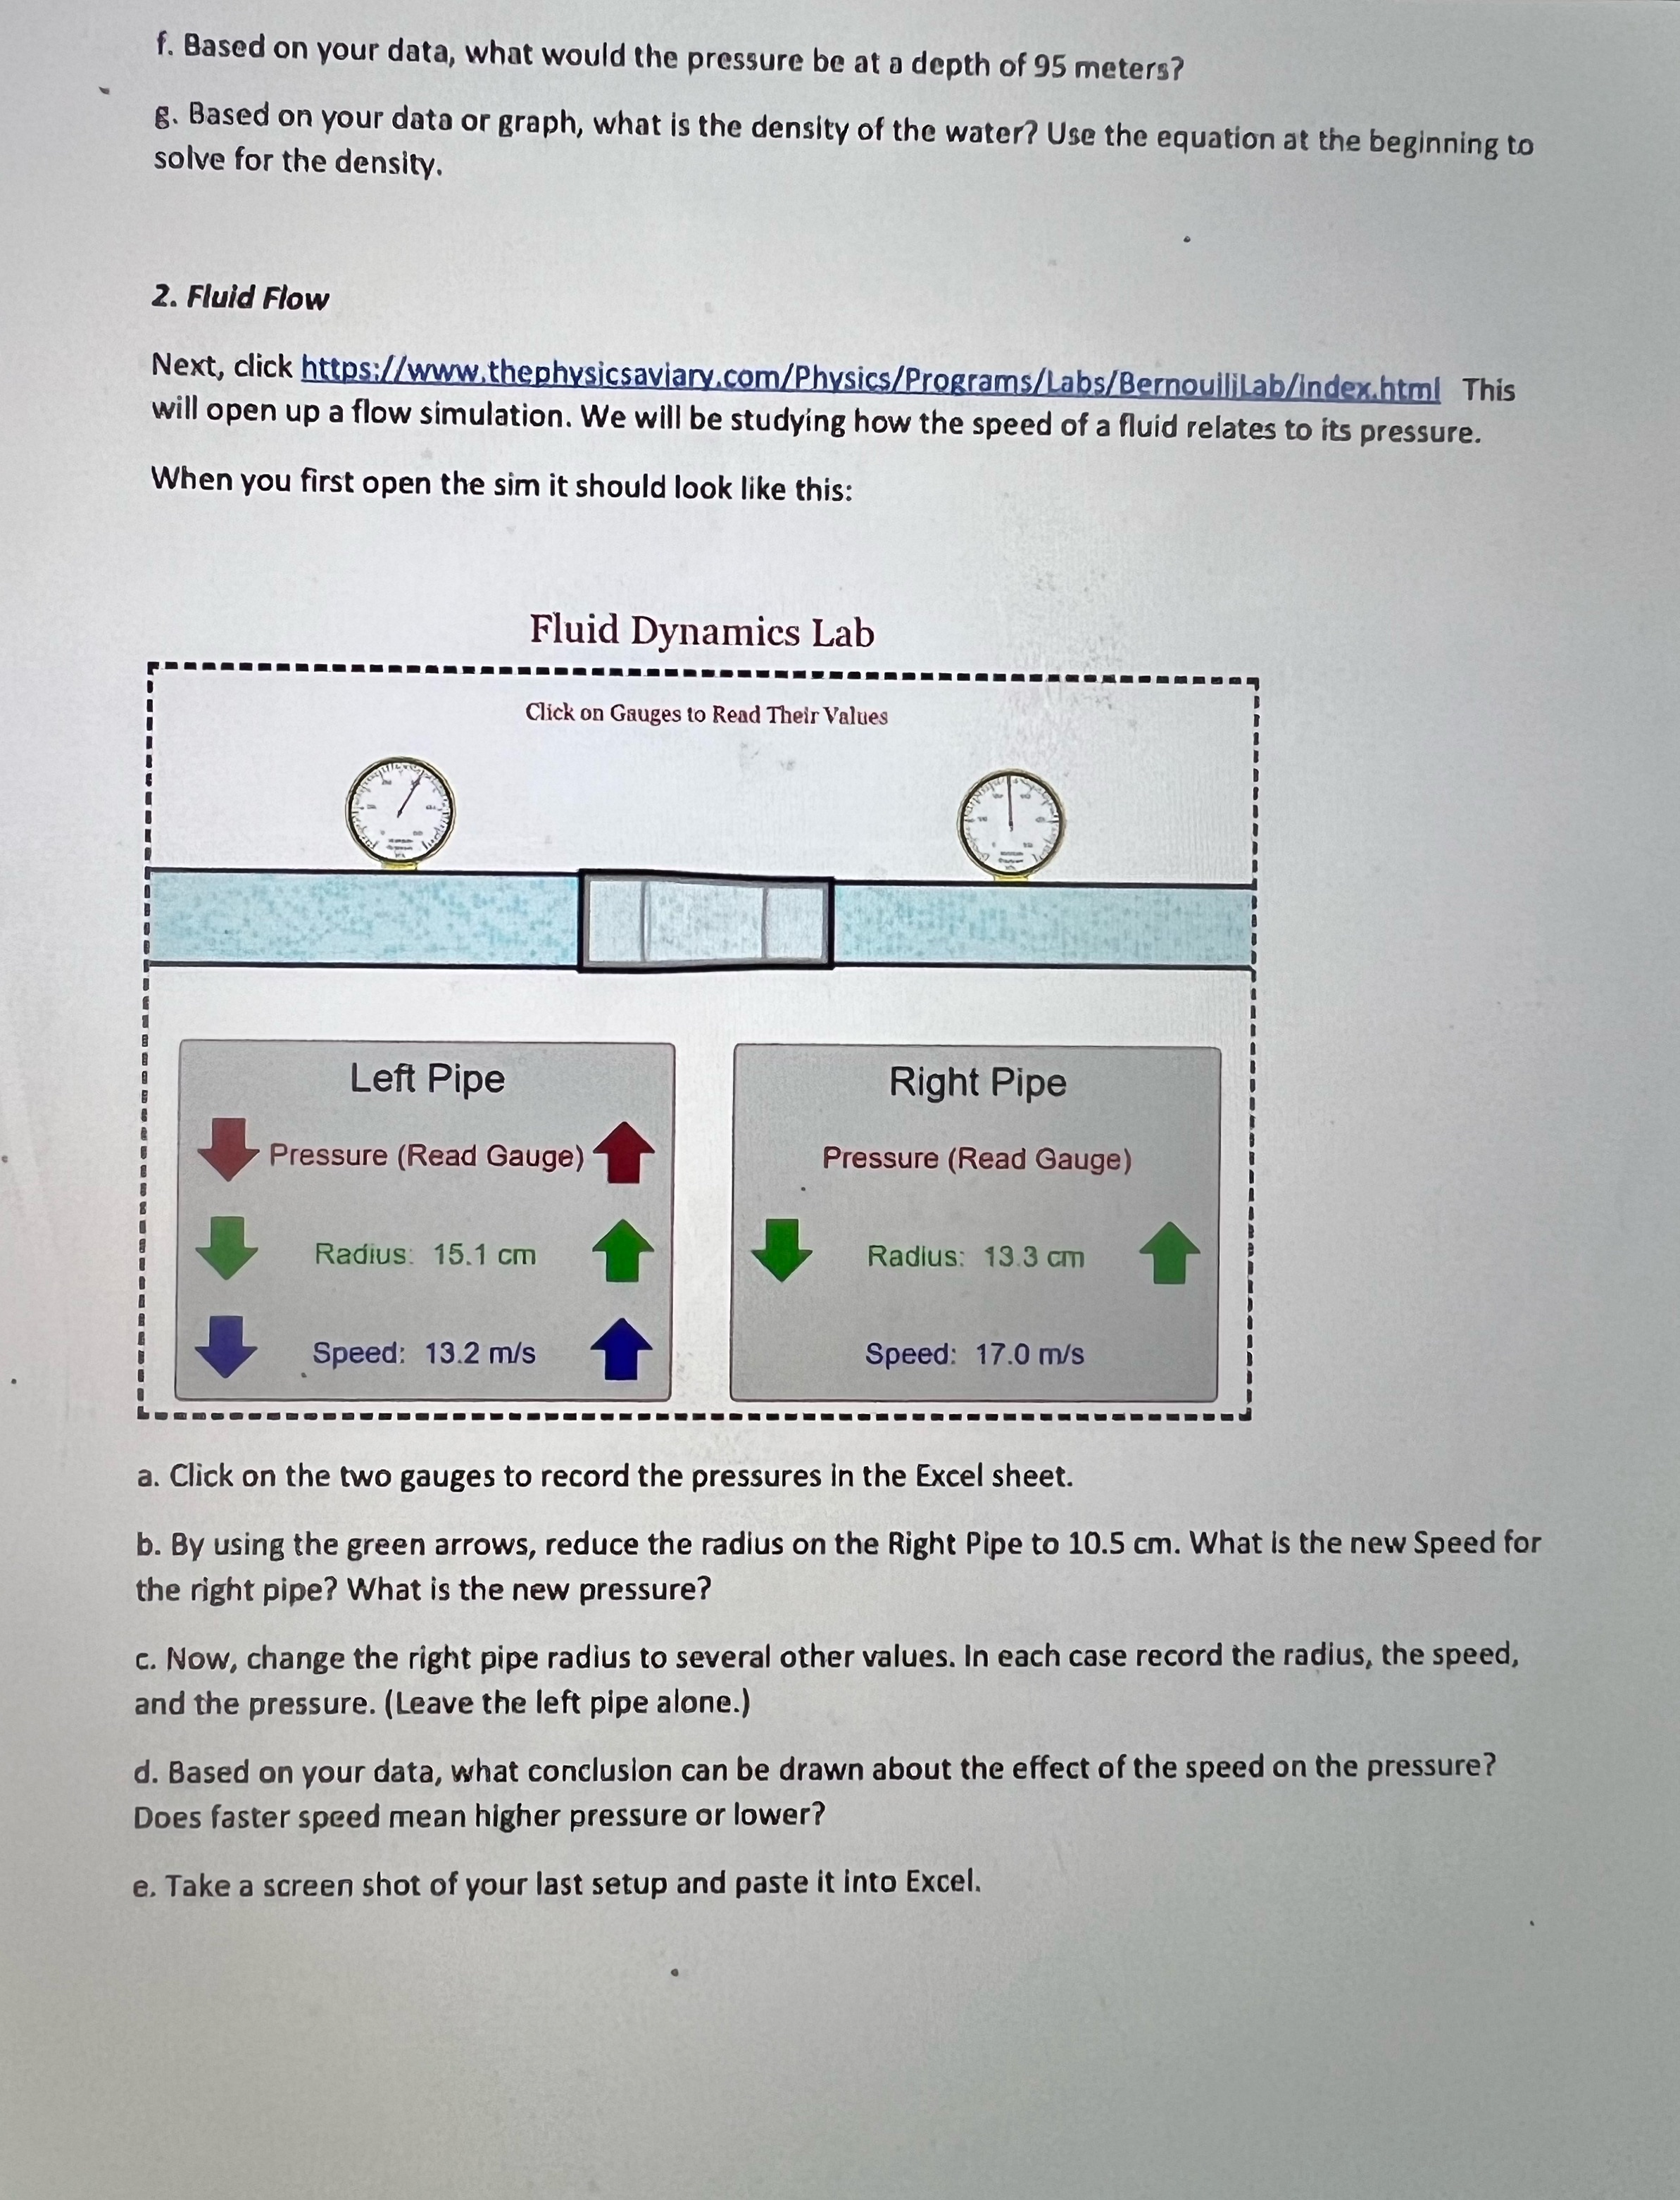
f. Based on your data, what would the pressure be at a depth of 95 meters? g. Based on your data or graph, what is the density of the water? Use the equation at the beginning to solve for the density. 2. Fluid Flow Next, click https://www.thephysicsaviary.com/Physics/Programs/Labs/BernoulliLab/index.html This will open up a flow simulation. We will be studying how the speed of a fluid relates to its pressure. When you first open the sim it should look like this: Fluid Dynamics Lab Click on Gauges to Read Their Values Left Pipe Right Pipe Pressure (Read Gauge) Pressure (Read Gauge) Radius: 15.1 cm Radius: 13.3 cm Speed: 13.2 m/s Speed: 17.0 m/s a. Click on the two gauges to record the pressures in the Excel sheet. b. By using the green arrows, reduce the radius on the Right Pipe to 10.5 cm. What is the new Speed for the right pipe? What is the new pressure? c. Now, change the right pipe radius to several other values. In each case record the radius, the speed, and the pressure. (Leave the left pipe alone.) d. Based on your data, what conclusion can be drawn about the effect of the speed on the pressure? Does faster speed mean higher pressure or lower? e. Take a screen shot of your last setup and paste it into Excel
Step by Step Solution
There are 3 Steps involved in it

Get step-by-step solutions from verified subject matter experts