

Question: f55 7.1 10 75 8.5 11 72 9.3 12 68 8.7 13 84 11.2 14 40 5.7 15 65 7.8 16 78 11.5fWhat is the
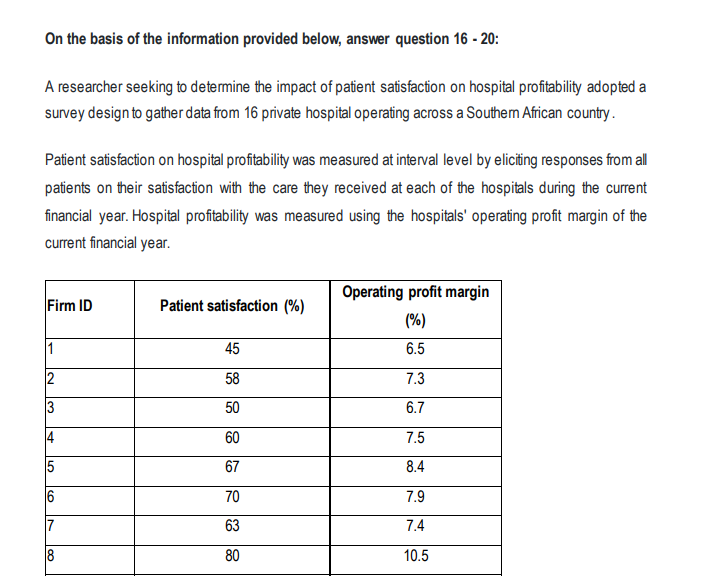
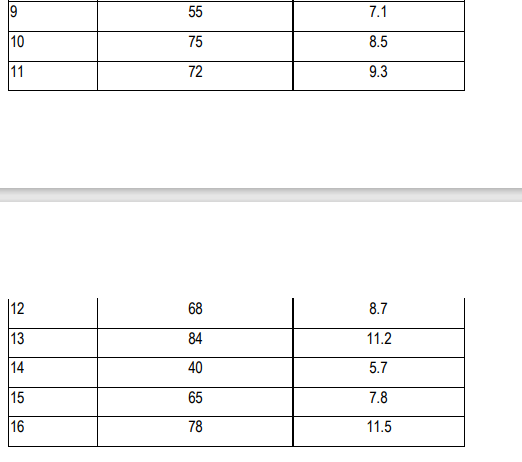
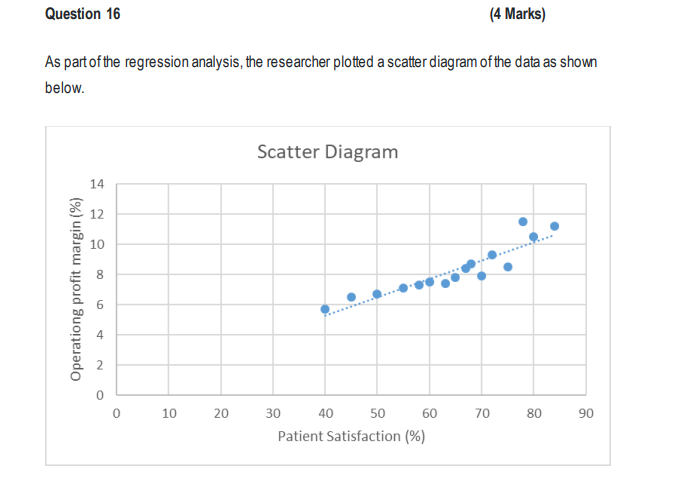
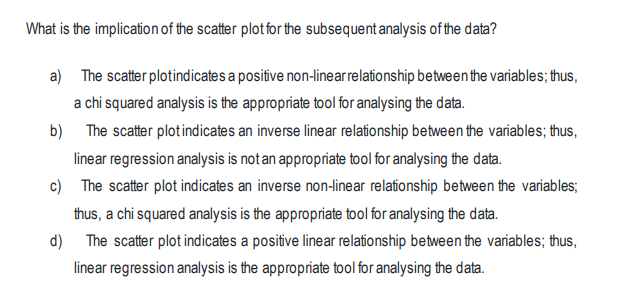
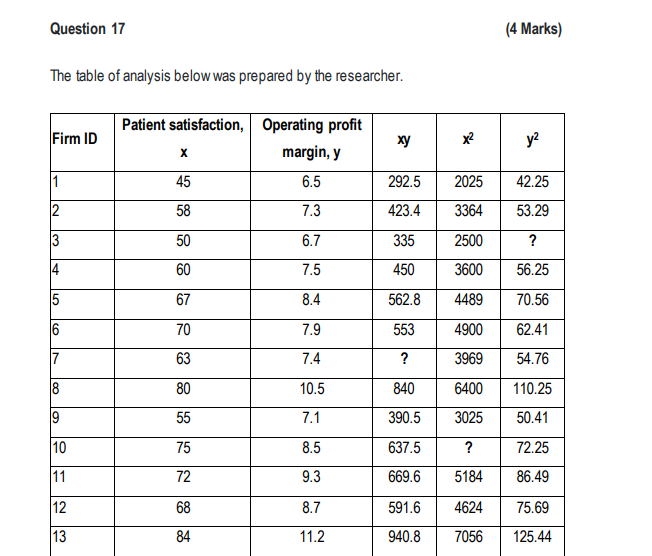
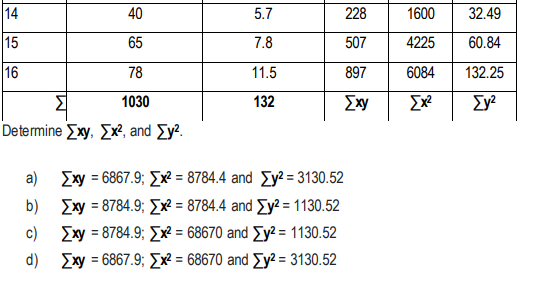
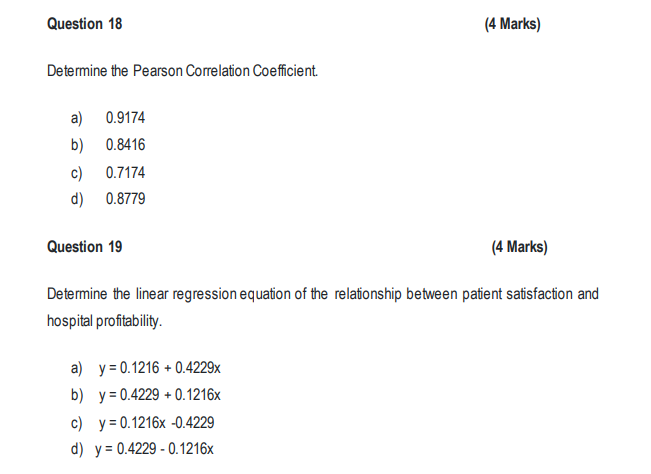
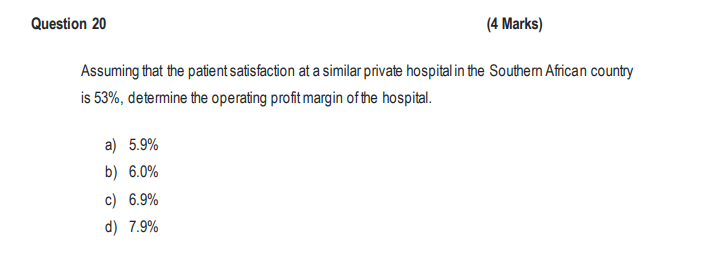
\f55 7.1 10 75 8.5 11 72 9.3 12 68 8.7 13 84 11.2 14 40 5.7 15 65 7.8 16 78 11.5\fWhat is the implication of the scatter plot for the subsequent analysis of the data? a) The scatter plotindicates a positive non-linear relationship between the variables; thus, a chi squared analysis is the appropriate tool for analysing the data. b) The scatter plotindicates an inverse linear relationship between the variables; thus, linear regression analysis is not an appropriate tool for analysing the data. c) The scatter plot indicates an inverse non-linear relationship between the variables; thus, a chi squared analysis is the appropriate tool for analysing the data. d) The scatter plot indicates a positive linear relationship between the variables; thus, linear regression analysis is the appropriate tool for analysing the data.Question 17 (4 Marks) The table of analysis below was prepared by the researcher. Patient satisfaction, | Operating profit Firm ID xy x2 y2 X margin, y 45 6.5 292.5 2025 42.25 2 58 7.3 423.4 3364 53.29 3 50 6.7 335 2500 ? 60 7.5 450 3600 56.25 5 67 8.4 562.8 4489 70.56 6 70 7.9 553 4900 62.41 63 7.4 ? 3969 54.76 8 80 10.5 840 6400 110.25 9 55 7.1 390.5 3025 50.41 10 75 8.5 637.5 ? 72.25 11 72 9.3 669.6 5184 86.49 12 68 8.7 591.6 4624 75.69 13 84 11.2 940.8 7056 125.44\fQuestion 18 (4 Marks) Determine the Pearson Correlation Coefficient. a) 0.9174 b) 0.8416 C) 0.7174 d) 0.8779 Question 19 (4 Marks) Determine the linear regression equation of the relationship between patient satisfaction and hospital profitability. a) y = 0.1216 + 0.4229x b) y = 0.4229 + 0.1216x c) y = 0.1216x -0.4229 d) y = 0.4229 - 0.1216xQuestion 2t: {4 Marks] assuming that the patient satisfaction at a similar private hospital in the Southem African country is 53%, determine the operating prot margin ofthe hospital. a} 5.9% o} sets o} sets at mass
Step by Step Solution
There are 3 Steps involved in it

Get step-by-step solutions from verified subject matter experts