

Question: Factor for Determining from R the Three-Sigma Control Limits for exhibit 13.7 X- and R-Charts FACTORS FOR R-CHART NUMBER OF OBSERVATIONS IN EACH SAMPLE n
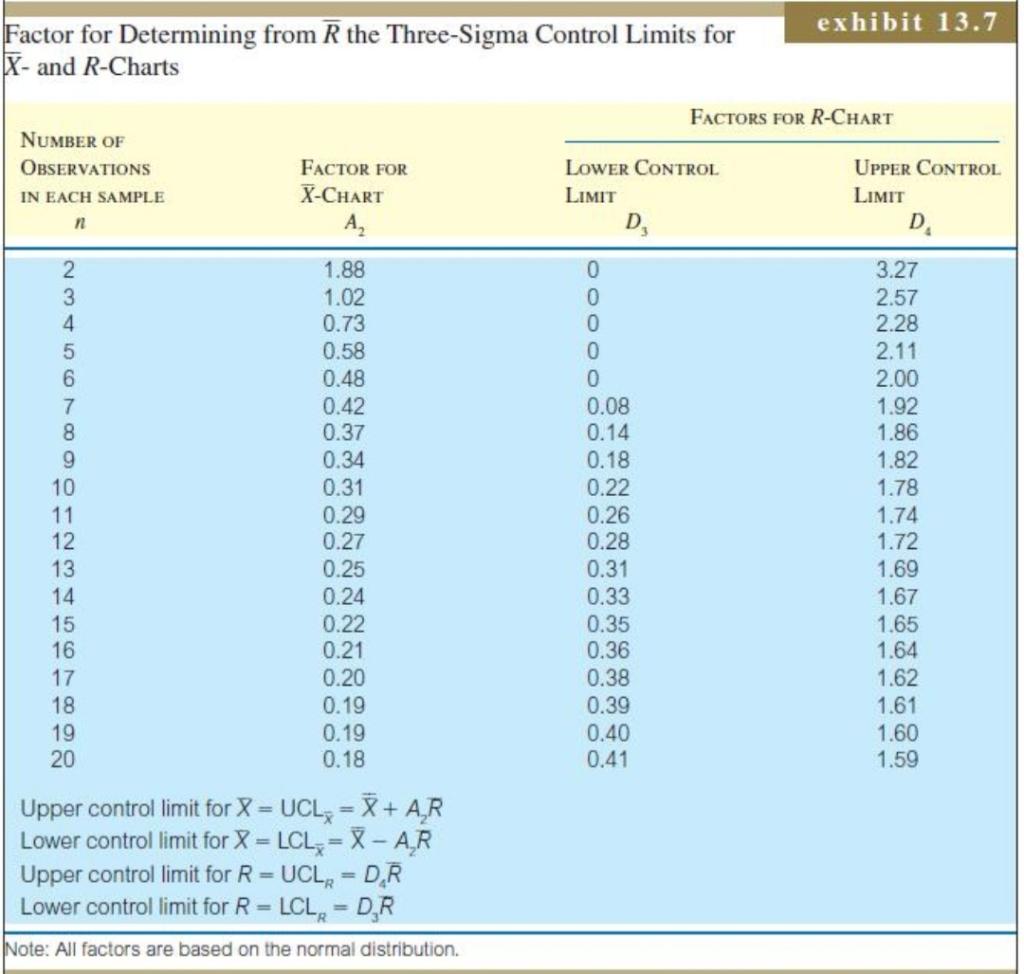
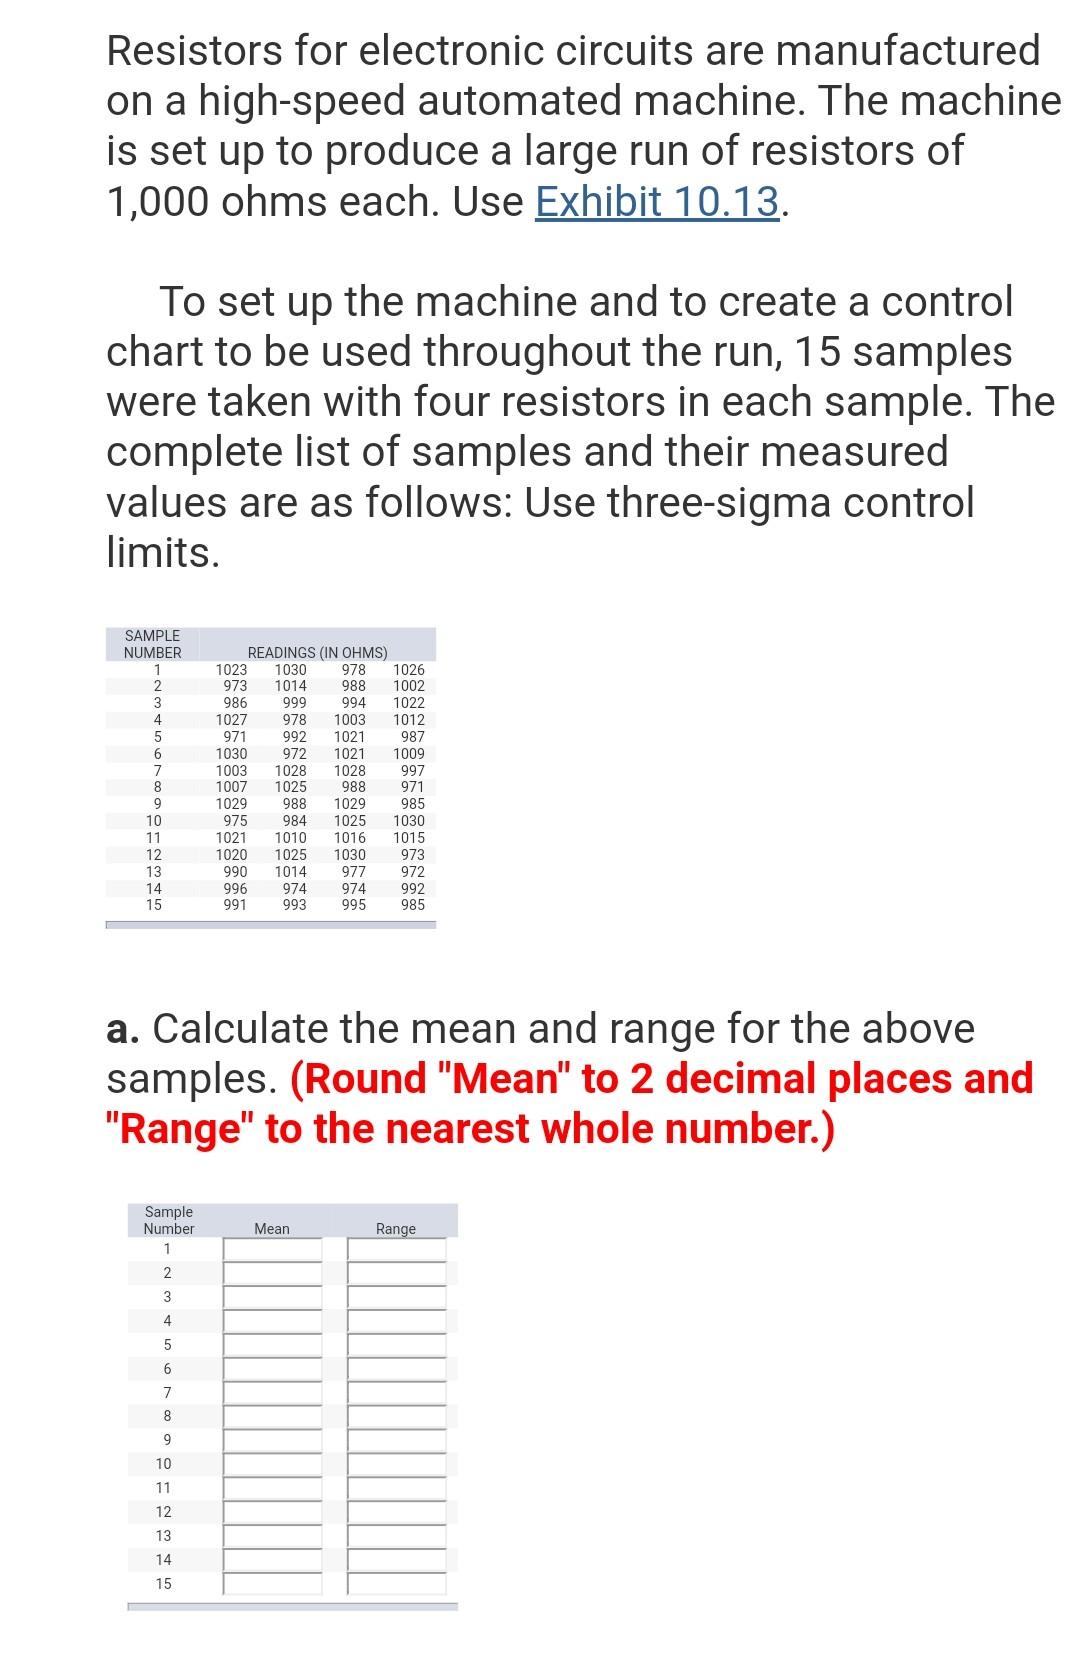
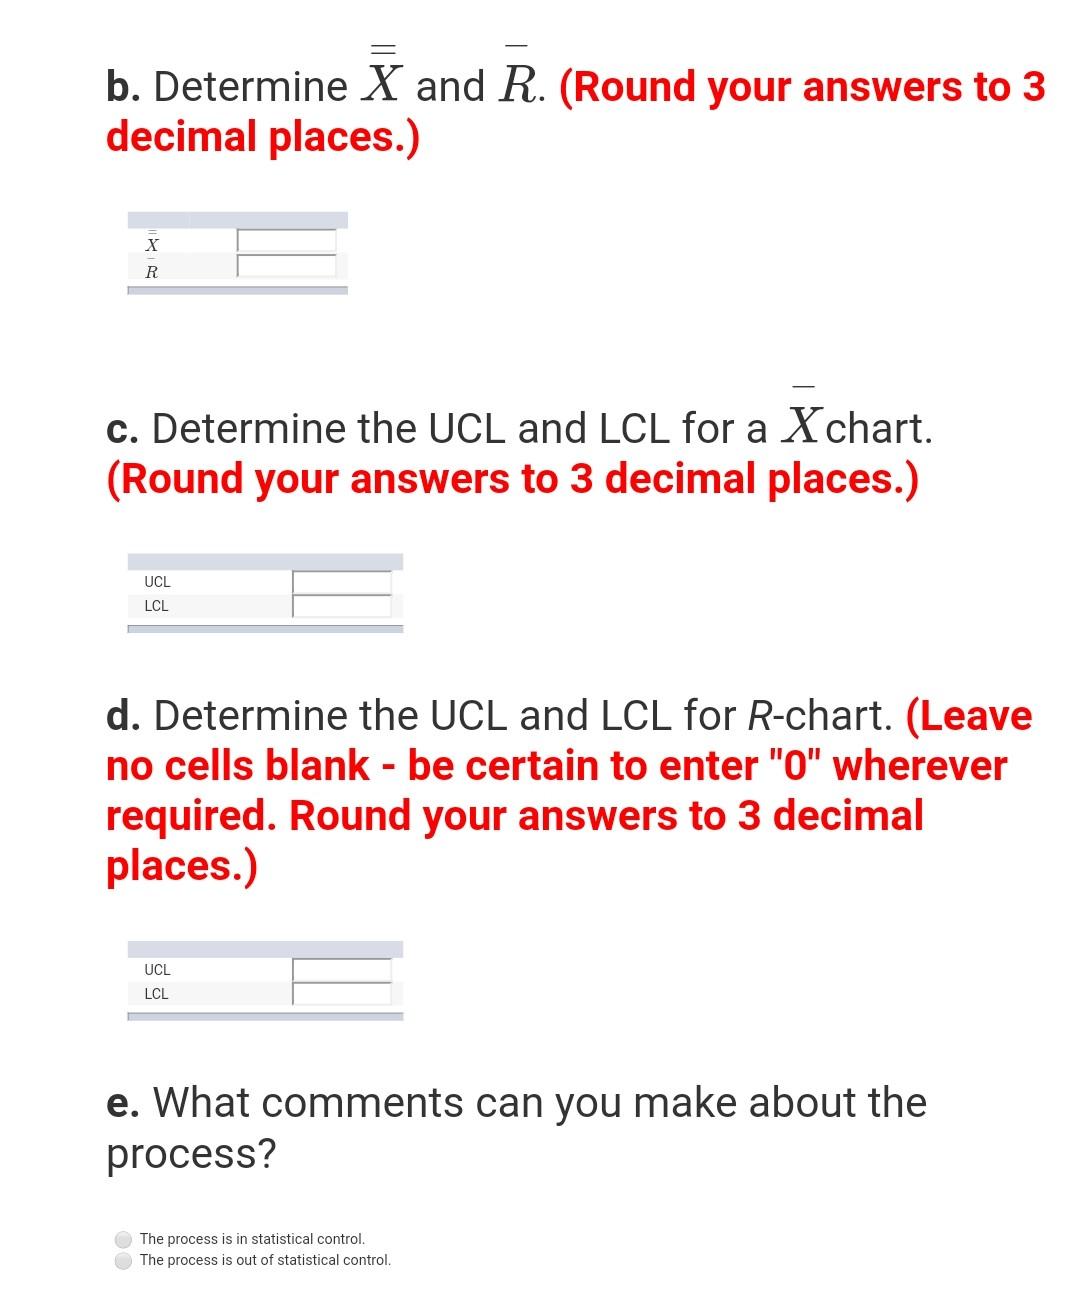
Factor for Determining from R the Three-Sigma Control Limits for exhibit 13.7 X- and R-Charts FACTORS FOR R-CHART NUMBER OF OBSERVATIONS IN EACH SAMPLE n FACTOR FOR X-CHART A, LOWER CONTROL LIMIT D. UPPER CONTROL LIMIT D. 2 3 4 5 6 7 8 9 10 11 12 13 14 15 16 17 18 19 20 1.88 1.02 0.73 0.58 0.48 0.42 0.37 0.34 0.31 0.29 0.27 0.25 0.24 0.22 0.21 0.20 0.19 0.19 0.18 0 0 0 0 0 0.08 0.14 0.18 0.22 0.26 0.28 0.31 0.33 0.35 0.36 0.38 0.39 0.40 0.41 3.27 2.57 2.28 2.11 2.00 1.92 1.86 1.82 1.78 1.74 1.72 1.69 1.67 1.65 1.64 1.62 1.61 1.60 1.59 Upper control limit for X = = UCL = + AR Lower control limit for X = LCL = X - AR Upper control limit for R=UCLR = D.R Lower control limit for R= - LCLR DR Note: All factors are based on the normal distribution. Resistors for electronic circuits are manufactured on a high-speed automated machine. The machine is set up to produce a large run of resistors of 1,000 ohms each. Use Exhibit 10.13. To set up the machine and to create a control chart to be used throughout the run, 15 samples were taken with four resistors in each sample. The complete list of samples and their measured values are as follows: Use three-sigma control limits. 1023 SAMPLE NUMBER 1 2 3 4 5 6 7 8 9 10 11 12 13 14 15 READINGS (IN OHMS) 1030 978 1026 973 1014 988 1002 986 999 994 1022 1027 978 1003 1012 971 992 1021 987 1030 972 1021 1009 1003 1028 1028 997 1007 1025 988 971 1029 988 1029 985 975 984 1025 1030 1021 1010 1016 1020 1025 1030 973 990 1014 977 972 996 974 974 991 993 995 985 1015 992 a. Calculate the mean and range for the above samples. (Round "Mean" to 2 decimal places and "Range" to the nearest whole number.) Sample Number 1 Mean Range 2 3 4 5 6 7 8 9 10 11 12 13 14 15 b. Determine X and R. (Round your answers to 3 decimal places.) X R c. Determine the UCL and LCL for a Xchart. (Round your answers to 3 decimal places.) UCL LCL d. Determine the UCL and LCL for R-chart. (Leave no cells blank - be certain to enter "0" wherever required. Round your answers to 3 decimal places.) UCL LCL e. What comments can you make about the process? The process is in statistical control. The process is out of statistical control
Step by Step Solution
There are 3 Steps involved in it
1 Expert Approved Answer
Step: 1 Unlock

Question Has Been Solved by an Expert!
Get step-by-step solutions from verified subject matter experts
Step: 2 Unlock
Step: 3 Unlock