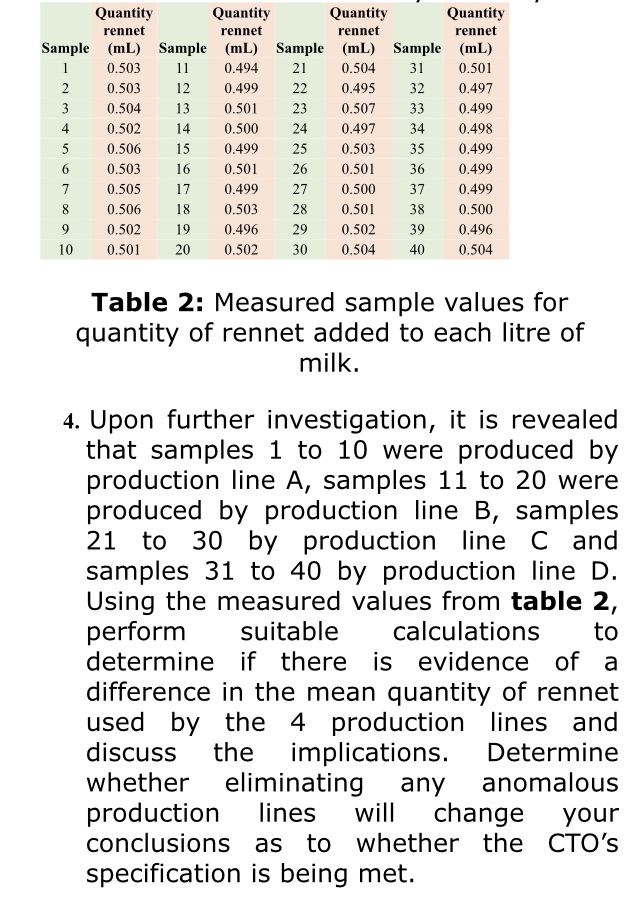
Question: Factorial experiment techniques Quantity Quantity Quantity Quantity rennet rennet rennet rennet Sample (mL) Sample (mL) Sample (mL) Sample (mL) 0.503 0.494 21 0.504 31 0.501

Factorial experiment techniques

Factorial experiment techniques Quantity Quantity
Quantity Quantity Quantity Quantity rennet rennet rennet rennet Sample (mL) Sample (mL) Sample (mL) Sample (mL) 0.503 0.494 21 0.504 31 0.501 0.503 12 0.499 22 0.495 32 0.497 0.504 13 0.501 23 0.507 33 0.499 0.502 14 0.500 24 0.497 34 0.498 0.506 15 0.499 25 0.503 35 0.499 0.503 16 0.501 26 0.501 36 0.499 0.505 17 0.499 27 0.500 37 0.499 00 - 0.506 18 0.503 28 0.501 38 0.500 0.502 19 0.496 29 0.502 39 0.496 10 0.501 20 0.502 30 0.504 40 0.504 Table 2: Measured sample values for quantity of rennet added to each litre of milk. 4. Upon further investigation, it is revealed that samples 1 to 10 were produced by production line A, samples 11 to 20 were produced by production line B, samples 21 to 30 by production line C and samples 31 to 40 by production line D. Using the measured values from table 2, perform suitable calculations to determine if there is evidence of a difference in the mean quantity of rennet used by the 4 production lines and discuss the implications. Determine whether eliminating any anomalous production lines will change your conclusions as to whether the CTO's specification is being met

Step by Step Solution

There are 3 Steps involved in it

1 Expert Approved Answer
Step: 1 Unlock blur-text-image
Question Has Been Solved by an Expert!

Get step-by-step solutions from verified subject matter experts

Step: 2 Unlock
Step: 3 Unlock

Students Have Also Explored These Related Accounting Questions!