

Question: Factors for calculating three-sigma limits for the x-chart and R-chart Click the icon to view the table of factors for calculating three-sigma limits for the
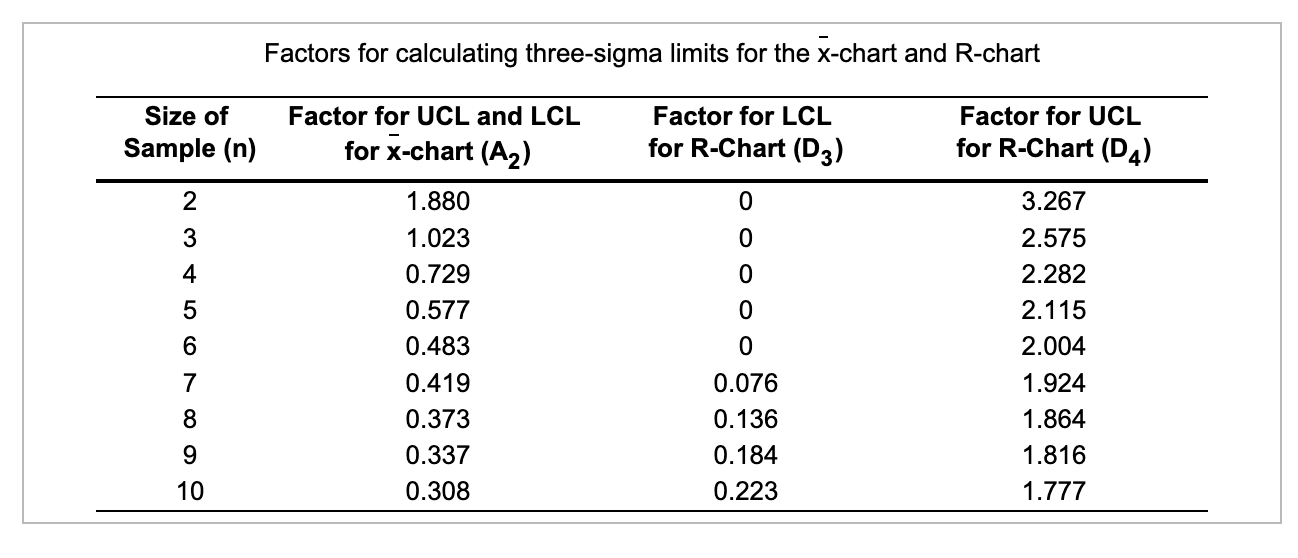
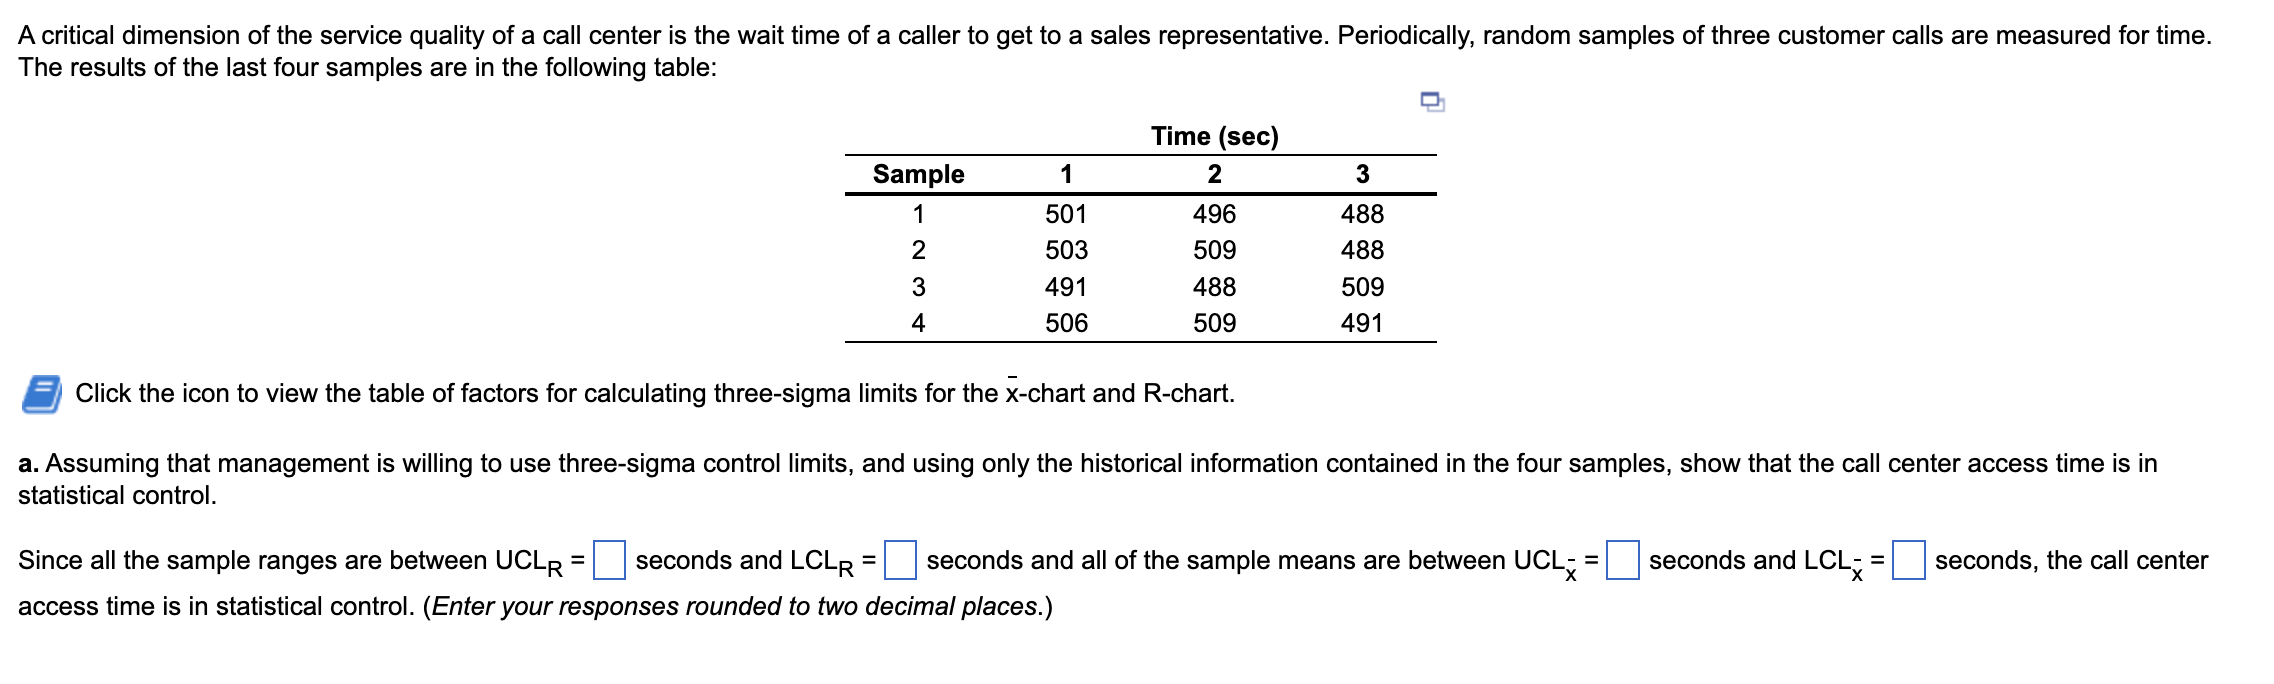
Factors for calculating three-sigma limits for the x-chart and R-chart Click the icon to view the table of factors for calculating three-sigma limits for the x-chart and R-chart. a. Assuming that management is willing to use three-sigma control limits, and using only the historical information contained in the four samples, show that the call center access time is in statistical control. Since all the sample ranges are between UCLR= seconds and LCLR= seconds and all of the sample means are between UCLx= seconds and LCLx= seconds, the call center access time is in statistical control. (Enter your responses rounded to two decimal places.)
Step by Step Solution
There are 3 Steps involved in it

Get step-by-step solutions from verified subject matter experts