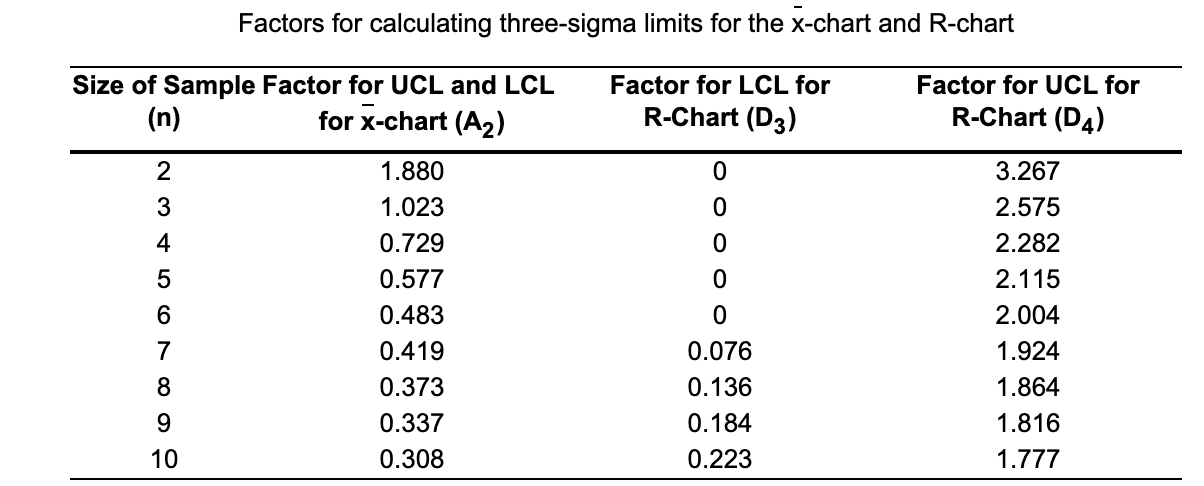
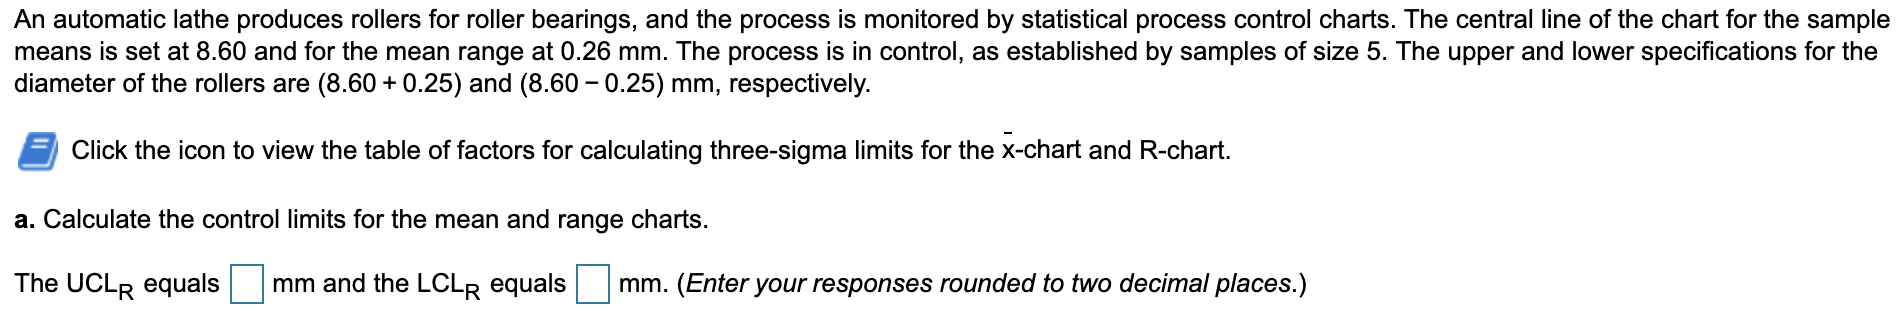
Question: Factors for calculating three-sigma limits for the X-chart and R-chart Size of Sample Factor for UCL and LCL (n) for X-chart (A2) Factor for LCL

Factors for calculating three-sigma limits forFactors for calculating three-sigma limits forFactors for calculating three-sigma limits forFactors for calculating three-sigma limits for

Factors for calculating three-sigma limits for the X-chart and R-chart Size of Sample Factor for UCL and LCL (n) for X-chart (A2) Factor for LCL for R-Chart (D3) Factor for UCL for R-Chart (D4) 0 0 0 5 0 o OVO AWN 1.880 1.023 0.729 0.577 0.483 0.419 0.373 0.337 0.308 0 3.267 2.575 2.282 2.115 2.004 1.924 1.864 1.816 1.777 0.076 0.136 0.184 0.223 9 c. If the process is not capable, what percent of the output will fall outside the specification limits? (Hint: Use the normal distribution.) b. If the standard deviation of the process distribution is estimated to be 0.18 mm, is the process capable of meeting specifications? Assume four-sigma quality. An automatic lathe produces rollers for roller bearings, and the process is monitored by statistical process control charts. The central line of the chart for the sample means is set at 8.60 and for the mean range at 0.26 mm. The process is in control, as established by samples of size 5. The upper and lower specifications for the diameter of the rollers are (8.60+ 0.25) and (8.60 -0.25) mm, respectively. Click the icon to view the table of factors for calculating three-sigma limits for the x-chart and R-chart. a. Calculate the control limits for the mean and range charts. The UCLR equals mm and the LCLR equals mm. (Enter your responses rounded to two decimal places.)

Step by Step Solution

There are 3 Steps involved in it

1 Expert Approved Answer
Step: 1 Unlock blur-text-image
Question Has Been Solved by an Expert!

Get step-by-step solutions from verified subject matter experts

Step: 2 Unlock
Step: 3 Unlock

Students Have Also Explored These Related General Management Questions!