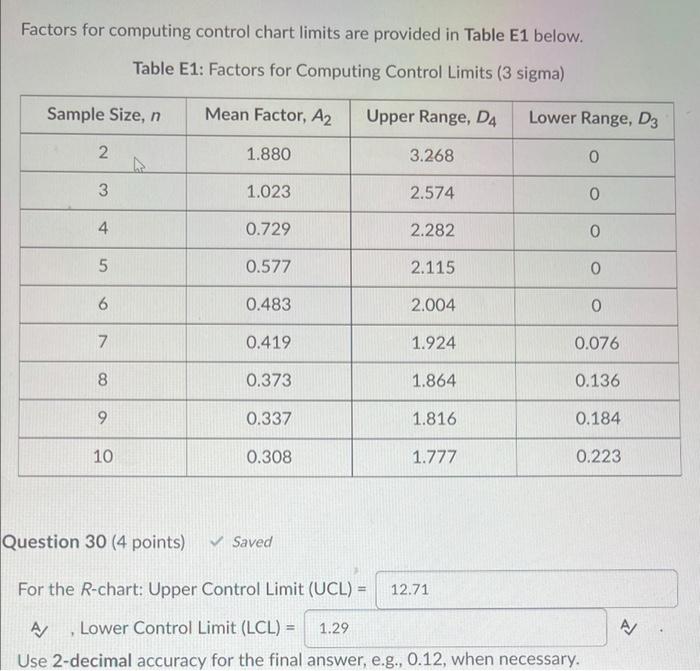
Question: Factors for computing control chart limits are provided in Table E1 below. Table E1: Factors for Computing Control Limits (3 sigma) Sample Size, n Mean

Factors for computing control chart limits are
Factors for computing control chart limits are provided in Table E1 below. Table E1: Factors for Computing Control Limits (3 sigma) Sample Size, n Mean Factor, A2 Upper Range, DA Lower Range, D3 2. 1.880 3.268 0 3 1.023 2.574 0 4 0.729 2.282 o 5 0.577 2.115 0 6 0.483 2.004 O 7 0.419 1.924 0.076 8 0.373 1.864 0.136 9 0.337 1.816 0.184 10 0.308 1.777 0.223 Question 30 (4 points) Saved For the R-chart: Upper Control Limit (UCL) = 12.71 A/ AJLower Control Limit (LCL) = 1.29 Use 2-decimal accuracy for the final answer, e.g., 0.12, when necessary. Factors for computing control chart limits are provided in Table E1 below. Table E1: Factors for Computing Control Limits (3 sigma) Sample Size, n Mean Factor, A2 Upper Range, DA Lower Range, D3 2. 1.880 3.268 0 3 1.023 2.574 0 4 0.729 2.282 o 5 0.577 2.115 0 6 0.483 2.004 O 7 0.419 1.924 0.076 8 0.373 1.864 0.136 9 0.337 1.816 0.184 10 0.308 1.777 0.223 Question 30 (4 points) Saved For the R-chart: Upper Control Limit (UCL) = 12.71 A/ AJLower Control Limit (LCL) = 1.29 Use 2-decimal accuracy for the final answer, e.g., 0.12, when necessary

Step by Step Solution

There are 3 Steps involved in it

1 Expert Approved Answer
Step: 1 Unlock blur-text-image
Question Has Been Solved by an Expert!

Get step-by-step solutions from verified subject matter experts

Step: 2 Unlock
Step: 3 Unlock

Students Have Also Explored These Related General Management Questions!