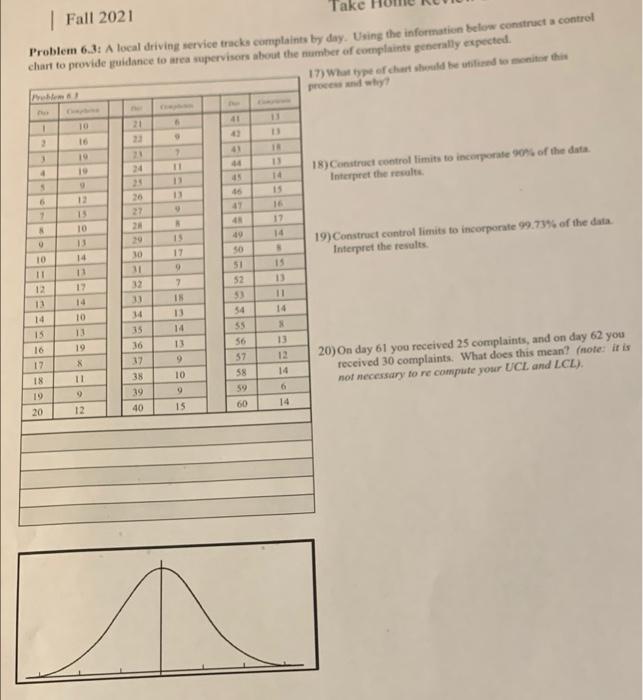
Question: | Fall 2021 Take Problem 6.3: A local driving service tracks complaints by day. Using the information below construct a control chart to provide guidance

| Fall 2021 Take Problem 6.3: A local driving
| Fall 2021 Take Problem 6.3: A local driving service tracks complaints by day. Using the information below construct a control chart to provide guidance to wrea supervisors about the number of complaints generally expected 17) What type of chart should be to monitor this 40 10 21 2 16 43 10 19 4 13 18 24 23 11 13 13 18) Construct control limits to incorporate of the data Interpret the results 16 47 1 15 10 27 2 LEEE 16 17 14 o 15 17 19) Construct control limits to incorporate 99.73% of the data Interpret the results 14 11 12 14 10 7 18 10 11 12 10 14 15 16 17 18 13 11 14 49 SO 51 52 53 54 55 56 57 31 32 33 14 15 36 17 38 39 40 19 14 13 9 13 12 14 X 20) On day 61 you received 25 complaints, and on day 62 you received 30 complaints. What does this mean? (note: it is not necessary to recompute your UCL and LCL). 58 6 59 10 9 15 11 9 12 10 60 14 20

Step by Step Solution

There are 3 Steps involved in it

1 Expert Approved Answer
Step: 1 Unlock blur-text-image
Question Has Been Solved by an Expert!

Get step-by-step solutions from verified subject matter experts

Step: 2 Unlock
Step: 3 Unlock

Students Have Also Explored These Related General Management Questions!