

Question: please help Problem 6.3: A local driving service tracks complaints by day. Using the information below construct a control chart to provide guidance to area
please help 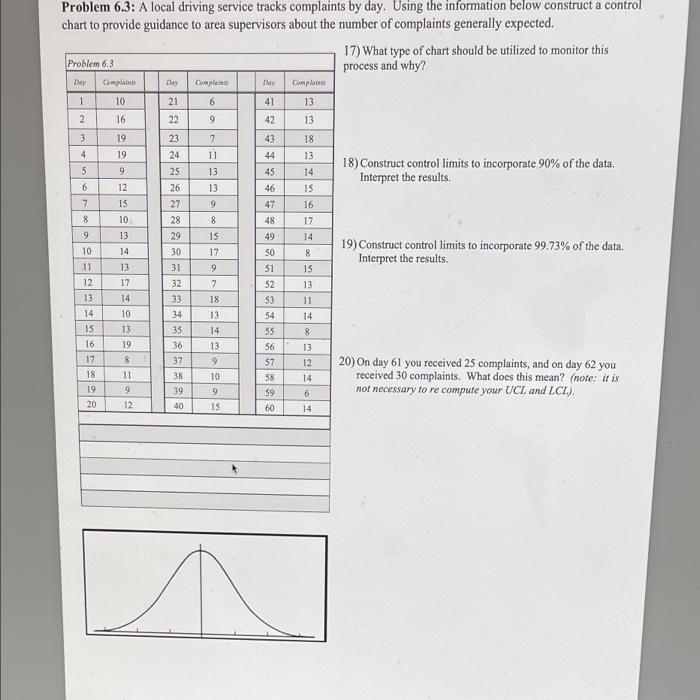
Problem 6.3: A local driving service tracks complaints by day. Using the information below construct a control chart to provide guidance to area supervisors about the number of complaints generally expected. 17) What type of chart should be utilized to monitor this process and why? Complaints Complet Problem 6.3 Day Day Day Con 1 10 21 6 41 13 13 2 16 22 9 42 3 3 19 43 18 4 19 13 S 9 6 23 24 25 26 27 28 29 18) Construct control limits to incorporate 90% of the data. Interpret the results. 12 7 11 13 13 9 8 15 7 15 15 16 17 8 8 10 9 13 14 30 17 8 19) Construct control limits to incorporate 99.73% of the data, Interpret the results. . 13 9 15 17 7 13 44 45 46 47 48 49 50 51 52 53 54 SS 56 57 58 59 60 31 32 33 34 35 18 10 11 12 13 14 15 16 17 18 19 20 11 14 10 13 14 8 36 37 19 8 11 9 12 13 14 13 9 10 9 15 38 39 13 12 14 6 14 20) On day 61 you received 25 complaints, and on day 62 you received 30 complaints. What does this mean? (note: it is not necessary to re compute your UCL and LCL). 40
Step by Step Solution
There are 3 Steps involved in it
1 Expert Approved Answer
Step: 1 Unlock

Question Has Been Solved by an Expert!
Get step-by-step solutions from verified subject matter experts
Step: 2 Unlock
Step: 3 Unlock